Formats
Chief Executive's foreword#
Kupu whakataki a te Tumu Whakarae

Kia ora koutou
The Department of the Prime Minister and Cabinet (DPMC) occupies a unique space within the heart of government, supporting the Prime Minister, Cabinet, and the Governor-General to lead and govern an effective New Zealand. The Department also plays an important role in building a stronger, more secure nation through national risk, resilience, and security policy coordination.
DPMC's people play a vital part in advancing an ambitious, resilient, and well-governed New Zealand. Today, New Zealand faces a range of complex challenges, including a more contested geopolitical environment, global economic uncertainty, rapid technological advancements, and the increasing impacts of climate change and other natural hazards. With that in mind, we are clear-sighted about the part we must play in helping improve the lives of every New Zealander.
It has been a busy year, and, like many other parts of government, DPMC has been examining how it operates to ensure it uses resources efficiently and effectively to deliver value and results for New Zealanders.
The Department embarked on a transformation programme to strengthen and streamline the organisation to ensure it continues to deliver now and into the future, and remain aligned with the priorities and strategic direction of the day. This year we completed a baseline review and consulted with staff on organisational change. Early in 2025/26 we will implement a new organisational structure to prepare us well in meeting the ever-changing demands facing DPMC and, indeed, all of New Zealand.
As Secretary and Chief Executive of the Department of the Prime Minister and Cabinet, I wear many hats, including National Security Advisor to the Prime Minister, Chair of the National Security Board, National Hazards Board, and the Officials' Committee for Domestic and External Security Coordination (ODESC).
DPMC led and coordinated the National Resilience System during significant crises this year, bringing agencies together at the appropriate level to ensure a collective response through ODESC systems meetings whenever the situation warranted.
DPMC has in the past often hosted or coordinated bespoke short-term units, task forces, reviews, or programmes that provide advice on specific issues. In 2024/25, DPMC's role in hosting the Chief Executive, Cyclone Recovery and the All-of-Government COVID-19 Royal Commission of Inquiry Unit concluded. DPMC also led the machinery of government changes to transfer responsibility for hosting the National Emergency Management Agency (NEMA) from DPMC to the Department of Internal Affairs (DIA). Our Strategic Intentions 2023/24 to 2026/27 will be updated during the coming year to reflect this change and the Government's expectations and priorities for DPMC.
The Department also continued to support the Governor-General in her ceremonial, constitutional, and community roles. DPMC serves as the steward of Government House and its grounds in Wellington, as well as Government House in Auckland, both of which are significant Crown assets.
The Policy Advisory Group and Delivery Unit have been instrumental in coordinating and leading the Government's policy processes and delivering free and frank advice. The Cabinet Office plays a pivotal role in supporting the Prime Minister, Cabinet, and Cabinet Committees by ensuring the smooth operation of executive government processes. It provides impartial, robust advice, facilitates decision-making, and upholds the highest standards of professionalism and integrity.
I want to express my gratitude and thanks to our people, without whom DPMC could not continue to consistently deliver high-quality work. As we navigate the often unpredictable international and local landscape, our people do so in a way that reflects our values, who we are as public servants, and as the diverse group of individuals who strive to serve New Zealand's best interests.
Ben King
Secretary of the Department of the Prime Minister and Cabinet, and Chief Executive
Te Tumu Whakarae mō Te Tari o te Pirimia me te Komiti Matua
Our story#
Te kōrero
This section sets out our strategic framework and key achievements in 2024/25.
Our strategic intentions#
He takunetanga rautaki
Who we are and what we do#
Ko wai mātou, he aha ā mātou mahi
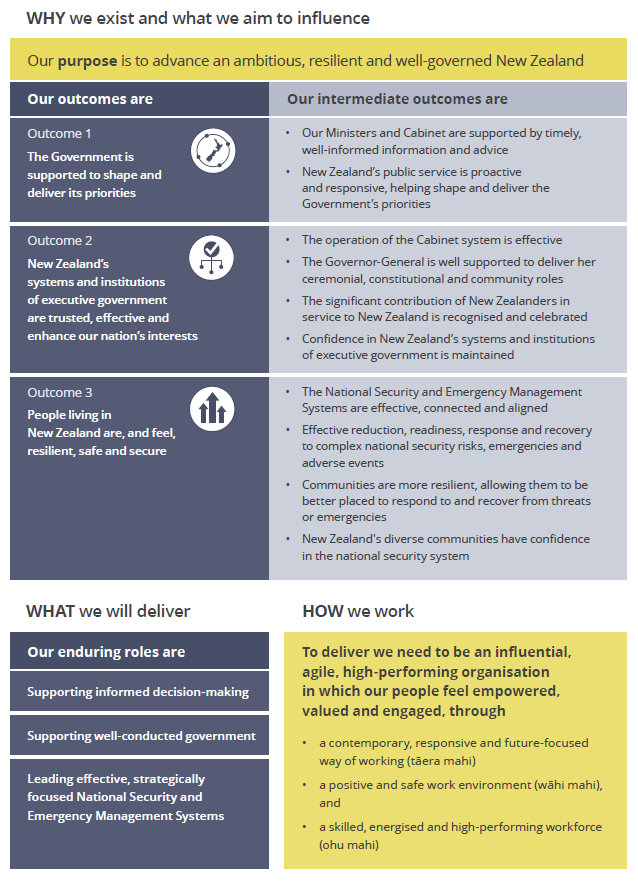
Our purpose is to advance an ambitious, resilient and well-governed New Zealand
At the Department of the Prime Minister and Cabinet (DPMC) Te Tari o te Pirimia me te Komiti Matua, we support the government of the day. We do this by leading, advising, stewarding and delivering activities across the public service, as well as providing specific advice and support to the Governor-General, Prime Minister and our portfolio Ministers.
As a central agency, we play a vital role in leading and coordinating public service agencies. We are uniquely placed to draw together and focus other public sector agencies to support the Government's priorities and to address effectively with issues and delivery of agreed programmes and policies.
Our functions and services are adapting to meet evolving needs and expectations, while our core purpose and enduring roles remain unchanged.
Our enduring roles which help us deliver on our purpose
Supporting informed decision-making
We provide the Prime Minister, Ministers and Cabinet with insights, advice, support and brokerage on the business of the day. We provide strategic advice, taking a comprehensive all-of-government view to assist the Government shape its agenda. Our advice aims to achieve alignment and greater momentum across the public sector. Additionally, we are responsible for shaping and progressing critical emerging issues.
We support the Prime Minister and Cabinet, which includes providing advice on all Cabinet and Cabinet Committee papers (excluding appointments), as well as emerging issues. We serve the Minister for National Security and Intelligence, and through the National Emergency Management Agency (NEMA) Te Rākau Whakamarumaru, and the functional Chief Executive, Cyclone Recovery we provide advice to the Minister for Emergency Management and Recovery.
Supporting well-conducted government
We support the Governor-General, Prime Minister and Ministers to exercise their constitutional roles. We ensure the smooth, lawful and trustworthy running of executive government through the provision of secretariat services, constitutional advice and support, legislative support and administration of the New Zealand Royal Honours system.
We support the Governor-General across the four main duties of the office: constitutional, ceremonial, community leadership and international. We also exercise stewardship of the heritage buildings and grounds of the Government Houses in Auckland and Wellington.
Leading effective, strategically focused national security and emergency management systems
We lead and steward the National Resilience System that comprises the national security, hazards, strategic crisis management and emergency management systems, so that they are integrated and function collectively to improve resilience to our most serious hazards and national security threats (National Risks). We support the National Hazards and National Security Boards and lead the all-hazards, all-threats strategic crisis management arrangements – Officials’ Committee for Domestic and External Security Coordination (ODESC).
We lead, coordinate and support the National Security System. We deliver ‘all source' assessments and support collaboration on nationally significant issues. We lead on national security advice for the Prime Minister, the Minister for National Security and Intelligence, and other relevant Ministers. We support the Prime Minister in international engagements and advancing our international interests.
We also, through NEMA, lead and coordinate across the Emergency Management System to reduce risk, and enable the system and communities to be ready for and able to respond to, and recover from, emergencies.
NEMA is a departmental agency hosted by DPMC until 25 September 2025 when host responsibility transfers to the Department of Internal Affairs. More information is set out in the National Emergency Management Agency Annual Report 2024/25 on pages 31 to 44.
Our year at a glance#
Te tau kua hipa
Outcome 1: The Government is supported to shape and deliver its priorities#
What we intended to achieve
- Ministers and Cabinet are supported by timely, well-informed information and advice
- The public service is proactive and responsive, helping shape and deliver the Government's priorities
DPMC is part of the glue that holds our system of government together and the oil that makes it run smoothly. We are uniquely placed at the centre, applying our whole-of-government perspective and our proximity to Ministers to steward the system of Government decision-making.
We play a pivotal role in shaping strategic policy priorities for the Government. DPMC also ensures the public service is aligned with, and gets traction on, delivery of Government targets.
Ministers require timely, well-informed, free and frank advice from a proactive and responsive public service. We are committed to lifting policy quality and capability across the public sector. Our targeted learning opportunities and ongoing guidance aim to build a high-performing policy system.
With a keen eye to the future, we support agencies in their stewardship role through the development of their Long-term Insights Briefings.
Like other policy agencies, DPMC also has a role in delivering services and programmes of work including providing first-opinion policy advice. This includes a number of time-limited functions such as recovery from the North Island severe weather events; as well as in our enduring role in national security, risk and resilience.
What we achieved in 2024/25
Provided effective oversight and support for significant Government priorities
Supported the Government to achieve its policy priorities
We provided the Prime Minister with free-and-frank policy advice on government priorities and matters of interest across all portfolios.
We collaborated with other central agencies to strengthen collective leadership and drive performance across the public service. This included support to establish and review the effectiveness of short, impactful interventions such as sprint teams to lift performance.
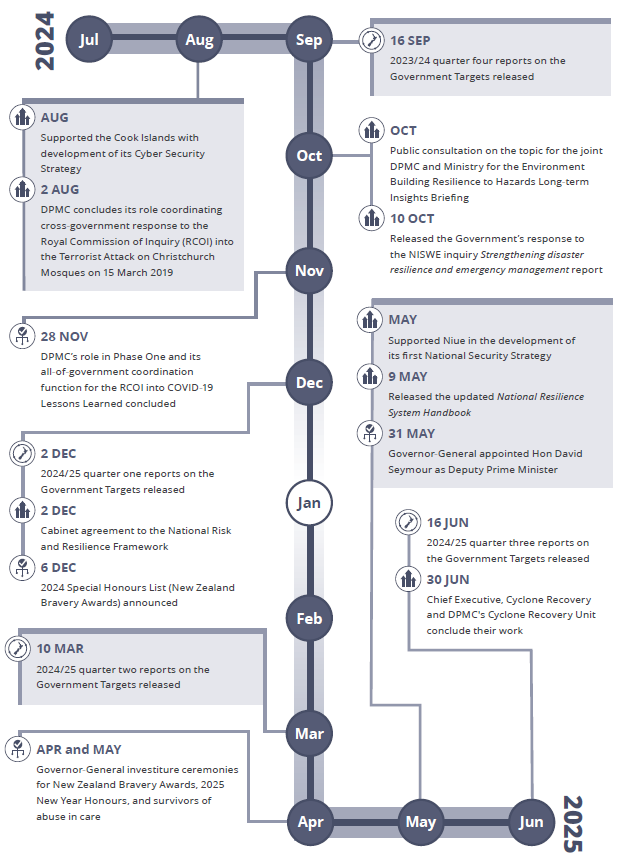
The nine Government Targets are focused on areas of significant public importance, covering the healthcare, justice, social, education, and environment sectors. The Targets drive delivery by focusing effort, resource, and accountability on lead agencies to deliver for New Zealanders. Operating in collaboration with the Treasury and Public Service Commission, the Delivery Unit in DPMC provides the delivery focus to central agencies' all-of-government perspectives to support the agencies leading these Targets. As of 30 June 2025 two Targets have been met, relating to emergency housing and reducing violent crime.
The Delivery Unit provided support for the Government's Quarterly Action Plan. The plan features a list of actions to be completed within the quarter, and these actions contribute to the outcomes that matter most to New Zealanders. The outcomes relate to rebuilding the economy, restoring law and order, and delivering better public services. Every quarter the Delivery Unit releases reporting on the Government's performance. During 2024/25, the Delivery Unit reported on progress of 161 actions.
In 2024/25:
2,048 policy professionals (2023/24: 1,729)
from
30 agencies (2023/24: 22)
attended
71 Policy Project workshops (2023/24: 71)
Lifted policy capability across the public sector
Providing high-quality advice that supports the Government to make informed decisions is a key role of the public sector. The Policy Project supports the Secretary of DPMC, who is also the Head of the Policy Profession, to build a high-performing policy system.
The Policy Project develops and delivers resources and training for policy practitioners. These strengthen the capability of agencies and policy professionals to provide robust, evidence-based advice that meets Ministers' needs and contributes to effective policy outcomes for New Zealand. For the first time, in 2024/25 the training was extended to Crown entities with a policy role, broadening the reach and impact of this capability-building initiative across the public sector.
In January 2025 the Policy Project surveyed agencies who provide policy advice to government to better understand policy system capability, policy quality and Ministerial satisfaction about their performance in 2023/24. This pulse check collated information from 29 agencies; revealing challenges and progress in lifting policy quality across government. The average policy quality score declined from 3.51 in 2022/23 to 3.45 out of 5 in 2023/24, highlighting the need for improvement in supporting informed government decision-making. Despite this, 92% of advice to Ministers met the acceptable standard, and Ministers expressed strong trust in officials, giving an average satisfaction score of 4 out of 5. This confidence reflects steady performance in key areas despite the system-wide challenges.
Making an impact on policy quality scores
In 2024/25, the Policy Project supported agencies to lift their policy capability by driving greater use of its tools and frameworks which was an increase on the prior year.
The January 2025 pulse check showed 22 of the 29 agencies had adopted policy capability improvement plans in 2023/24, up from 14 the previous year, reflecting a growing commitment to structured capability-building. Agencies with capability improvement plans performed better than those without, achieving an average policy quality score of 3.6 out of 5, compared to 3.3, demonstrating embedding these tools and plans is making a tangible difference in improving system-wide policy capability.
At the same time, 96% of agencies were using the Policy Skills Framework and Development Pathways Tool, compared to 82% in 2022/23. These resources are helping agencies identify skill gaps, strengthen policy teams, and build the foundations for quality advice.
These insights are driving the Policy Project's focus for 2025/26, including supporting more agencies to develop or enhance policy capability plans and coordinating a system-wide response to lift policy quality further. Priorities will also include reflecting strategic thinking and innovation within policy advice and expanding targeted training and events to address critical capability gaps. These actions are designed to accelerate improvement and ensure the policy system delivers consistently high-quality advice to meet Ministers' expectations.
Supported development of long-term strategic approaches
The New Zealand Public Service has a duty of stewardship, to look ahead and provide advice on future challenges and opportunities. This requires us to think, anticipate, and act in the future interests of people in New Zealand. To achieve this, the Public Service Act 2020 requires departmental chief executives to publish a Long-term Insights Briefing (LTIB) at least once every three years.
DPMC, through the Policy Project, supports LTIBs by providing guidance, coordination, and fostering collaboration across agencies to ensure briefings meet their statutory purpose while promoting stakeholder and community engagement.
In 2023/24:
96%
of agencies used skills framework and tools (2022/23: 82%)
22
agencies adopted policy improvement plans (2022/23: 14)
0.3
higher average score out of 5 (3.6) than agencies without plans (3.3)
By 30 June 2025, 22 LTIBs were in progress, covering themes such as fiscal sustainability, technological change, regional disparities, addressing mental health, and the needs of children and young people. These briefings are shaping departmental work programmes and strengthening public sector capability in futures thinking, engagement, and communication. This process has included a strong focus on agencies collaborating across portfolios and engaging with communities and stakeholders to improve outcomes for New Zealanders.
Case Study - Effective use of Central Agencies' collective capabilities to support Target delivery
The Delivery Unit in DPMC works with central agencies to increase delivery focus in the public sector on outcomes that matter most to New Zealanders in health, education, law and order, work, housing and the environment.
DPMC worked with the Treasury, Public Service Commission and the Social Investment Agency to collectively support lead agencies in their planning and delivery towards achievement of the nine Government Targets.
The Delivery Unit formed central agency teams to ensure that when working with agencies that lead Government Targets feedback and advice on issues, and for reducing barriers to target delivery, was well coordinated.
Central agencies' collective focus led to assessments of agency performance and the sufficiency of each agency's delivery plan in achieving Target performance. It also resulted in the identification of barriers to delivery, and timely insights and advice to Target lead agencies.
The Delivery Unit's influential role with other central agencies has contributed to DPMC's strategic outcome of supporting the Government to shape and delivery its priorities.
Government Targets focus attention, resources and accountability on improving service outcomes, with quarterly results published on the DPMC website.
For those Targets where there are delivery challenges, the Delivery Unit works closely with central agencies strengthening monitoring and support for Target lead agencies. This has enabled timely interventions and support to drive delivery and improve target performance.
Measuring our progress
This outcome is about supporting informed decision-making and supporting the Government to deliver its priorities.
At an agency level, we achieve this through the advice we provide and the work we do with Ministers and agencies across the system to help shape and drive the Government's priorities. While decisions are made by others (such as Ministers and Cabinet), we measure our success through the quality of advice and satisfaction with the support we provide.
Our performance this year against these measures is summarised in the table below which shows that:
- Policy quality - we achieved 3.5 (acceptable) out of 5 (outstanding) for the quality of our policy advice. While this is an improvement on our score last year, it is below our target of 4 (good). Continuing to improve the quality of our advice is a priority for us in 2025/26 as DPMC will action the feedback from the policy quality review panel.
- Ministerial satisfaction - we achieved 4.1 (expectations met most of the time) out of 5 (expectations always met) which was a slight decrease on base year. This shows we have further work to improve our advice and services to Ministers to meet or exceed our baseline.
At a system level we support the Head of the Policy Profession and agencies to build the capability needed to provide high-quality advice to Ministers and Cabinet. While we are not accountable for the policy quality of these agencies, we measure our success in relation to the use of the tools and support we provide.
In 2024/25 there was increased uptake of our tools and frameworks. This has enabled a more standardised approach to measuring performance and identifying skill and capability gaps in agencies and across the system. While the full impact will take time to show, we are already seeing a more consistent approach to assessing policy quality.
Our performance this year against these measures is summarised in the table below which shows that:
- Uptake of Policy Project tools and frameworks - an increasing number of agencies are using the Policy Project's frameworks, with eight more agencies developing a capability development plan in 2023/24.
| Indicator | Desired trend | Baseline 2022/23 |
Progress 2023/24 |
Progress 2024/25 |
Agency contributing to this outcome |
|---|---|---|---|---|---|
| Quality of policy advice and assessments | ↑ | 3.6 | 3.4 | 3.5 | DPMC and NEMA |
| Prime Minister and Ministerial satisfaction with advice and servicing | → or ↑ | 4.2 | 4.2 | 4.1 | DPMC and NEMA |
Uptake of Policy Project tools and frameworks in support of improving policy quality across the public sector |
→ or ↑ | See below[1] | DPMC | ||
|
- | 50% | 76% | ||
|
- | 85.2% | 96% | ||
|
- | 89.3% | 96% | ||
| Key to the indicators: ↑ Increase → Maintain | |||||
The way in which we measure these indicators is set out on page 49.
Outcome 2: New Zealand's system and institutions of executive government are trusted, effective and enhance our nation’s interests#
What we intended to achieve
- Effective operation of the Cabinet system
- Well-supported Governor-General
- New Zealanders' service recognised and celebrated
- Confidence in our systems and institutions of executive government
DPMC supports the Governor-General, Prime Minister and Ministers to exercise their constitutional roles. We ensure the smooth, lawful and trustworthy running of executive government through our support services. This is central to DPMC's role in stewarding the system of Government decision-making.
DPMC manages an effective Cabinet system, supporting the conduct of government business during elections, and facilitating the smooth transfer of power between administrations.
We ensure the Governor-General receives comprehensive support to fulfil her ceremonial, constitutional, and community roles. This includes managing heritage buildings and grounds of the Auckland and Wellington residences, and visitor services.
Public awareness of the New Zealand Royal Honours system and its administration contributes to confidence in the way significant contributions from New Zealanders are recognised.
Functional responsibilities that contribute to maintaining public confidence in New Zealand's systems and institutions of executive government include providing governance stewardship of the National Resilience System, strategic crisis management arrangements, and our community engagement in the development of policy advice. Our time-limited responsibilities include our community engagement in delivery of cyclone recovery and resilience initiatives.
What we achieved in 2024/25
Increased public awareness of the New Zealand Royal Honours system
The Governor-General hosted 39 ceremonies in Auckland and Wellington at which she invested 368 people with their New Zealand Royal Honours insignia. The Governor-General describes her involvement in investiture ceremonies as one of the most important duties she performs on behalf of His Majesty King Charles III, King of New Zealand.
Investiture ceremonies present an opportunity for friends and family to join the Governor-General in recognising and celebrating the service, achievements and dedication of recipients. Special events were held in April and May 2025 to recognise recent recipients of New Zealand Bravery Awards and those who have advocated for survivors of abuse in care.
Each ceremony is recorded and shared online. Images and citations of the recipients are also posted on the Governor-General's social media pages, helping to raise awareness of the Royal New Zealand Honours system and the very worthy recipients recognised through it.
Supported the operation of executive government and Cabinet decision-making
The Cabinet Office provided impartial and high-quality secretariat services to Cabinet and Cabinet committees to support effective executive government decision-making.
We also worked closely with Ministers during the year to advise and support them in identifying and managing conflicts of interest. The process in place for registering interests and agreeing management plans contributes to the maintenance of public trust and confidence in decision-making.
We provided advice to the Governor-General, Prime Minister and Ministers on a range of constitutional, policy and procedural issues to support them to fulfil their roles.
This included supporting the Prime Minister to prepare for and announce portfolio changes, briefing new Ministers, and managing arrangements for the formal transition between Deputy Prime Ministers on 31 May 2025.
1,528
Number of agenda items considered at Cabinet and Cabinet committee meetings in 2024/25 (2023/24: 1,252)
99.55%
of Cabinet and Cabinet committee policy papers published on time (2023/24: 90% of all papers)
98.68%
of Cabinet minutes published on time (2023/24: 98%)
0%
Cabinet and Cabinet committee minutes requiring subsequent amendment (2023/24: 0.3%)
Supported building trust and confidence in government agencies
Coordinated all-of-government crisis management through ODESC
Effective responses to crises builds trust and confidence in government agencies. This is because those affected the most experience the results of cross-agency collaboration through clear communication, rapid resolution and mitigation of impacts. Without effective coordination, trust in the public service and institutions of executive government may decline. This activity also contributes to the achievement of Outcome Three on pages 16 to 21.
The ODESC system is New Zealand's all-hazards, all-threats strategic crisis management system. The system guides agencies' involvement in crisis management, to ensure resources are directed to where they are most needed and that risks, implications, and mitigations across agencies are understood and addressed.
The Prime Minister is the lead decision maker in the ODESC system, supported by the Secretary of DPMC as Chair. We supported all-of-government coordinated decision-making through convening the ODESC system.
In 2024/25, the ODESC system was activated in response to a number of matters including:
- continuing support for the safe release of the New Zealand citizen being held hostage in Papua
- the grounding and sinking of the New Zealand Navy vessel HMNZS Manawanui in Samoa
- ensuring a safe environment for peaceful demonstrations of the October 2024 hīkoi
- the highly pathogenic Avian Influenza outbreak in December 2024
- the Chinese naval activity in the Tasman Sea, and
- the Israel-Iran conflict in June 2025.
We refreshed the National Exercise Programme to focus on simulated activations of the ODESC system and strengthening agencies' understanding of their roles and responsibilities for preparing for and responding to strategic crises.
Coordinated input to Royal Commission into COVID-19 Lessons Learned
The Royal Commission into COVID-19 Lessons Learned Phase One report was submitted to the Minister on 28 November 2024. DPMC's role in Phase One and its all-of-government coordination function concluded on 28 November 2024. DPMC established an internal time-limited unit to coincide with Phase Two of the Inquiry to manage its own input into the second phase due to conclude by 26 February 2026.
During Phase One, DPMC:
- delivered evidential responses to the Inquiry's requests for information from DPMC
- worked across agencies to minimise duplication and close information gaps
- compiled a narrative of DPMC and the various independent advisory groups' work that supported decision-makers
- documented the communications and public health engagement approach designed to keep New Zealanders safe, and
- developed a “Timeline of Significant COVID-19 Events”, a legacy document that will serve as a lasting record of the response.
Engaged meaningfully with communities and others we work with
Engaging with cyber security stakeholders
In partnership with the Government Communications Security Bureau, DPMC undertook targeted engagement to identify priorities for future action. We engaged with around 400 stakeholders from the cyber security sector to ensure New Zealand's cyber security policy settings remain relevant to the contemporary threat. These stakeholders included critical infrastructure entities, industry peak bodies, Non-Government Organisations, and iwi organisations.
This ensured that our work was informed by and responsive to the cyber security industry and strengthened relationships with those working in this area. We discussed how the government can:
- better work with industry and international partners
- incentivise enhanced cyber security throughout the economy, and
- improve government's capacity to prepare and respond to cyber security incidents.
Pacific national security coordination
Our Pacific national security coordination function has concluded its two-year programme working with Pacific Islands countries to help develop and strengthen approaches to national security. As New Zealand's national security is intertwined with the security, stability and resilience of the Pacific region, our work with these countries has strengthened New Zealand's national security. Programme highlights included:
- engagement with over 200 Pacific stakeholders on a range of national security topics, from all Pacific Islands Forum countries
- bespoke national security roundtables and conversations with over 20 Pacific leaders, including four heads of state
- supporting four Pacific countries to develop national security policies, aligning with the Boe Declaration on Regional Security
- facilitated opportunities for Pacific national security experts to gain and share security knowledge, for example on cyber security, and
- supported two Pacific countries to strengthen security-related legislation.
Regional visits undertaken by the Governor-General
The Governor-General undertook three regional visits during the year to the Chatham Islands (November 2024), Northland (March 2025) and Whakatane (June 2025). The itinerary included visits to schools, early childhood care centres and community centres. These visits help to highlight the work undertaken by the programmes and volunteers.
In addition, the Governor-General continued to support Patronages and community organisations by attending and speaking at events throughout the year.
We continued to promote understanding of the role of the Governor-General in our system of government by conducting educational tours from schools, external visits for the elderly and community groups, and public tours, of Government House. |
|
| 3,526 | visitors (2023/24: 4,620) |
| 213 | tours: (2023/24: 214) |
| 73 | community group tours (2023/24: 87) |
| 65 | education group tours (2023/24: 73) |
| 60 | public tours (2023/24: 54) |
| 9 | external presentations to Wellington schools and community groups (2023/24: 10) |
| 4 | virtual tours to schools outside Wellington region (2023/24: 2) |
| 11 | tours of Government House Auckland gardens (2023/24: 15) |
Case Study - Supporting the transition between Deputy Prime Ministers
The Cabinet Office supported the transition of the Deputy Prime Minister portfolio from Rt Hon Winston Peters to Hon David Seymour on 31 May 2025.
The Deputy Prime Minister exercises the statutory or constitutional functions and powers of the office of Prime Minister if the Prime Minister is unavailable. The Government's Coalition Agreements, signed in November 2023, specified that the Deputy Prime Minister portfolio would transition half-way through the parliamentary term from the Leader of the New Zealand First Party to the Leader of the ACT Party.
The transition took place at a ceremony hosted by the Governor-General at Government House Auckland on Saturday, 31 May 2025. It involved the Prime Minister formally advising the Governor-General to appoint Hon Seymour to the Deputy Prime Minister portfolio by signing a warrant of appointment, which was later sealed with the Seal of New Zealand. In her remarks, Her Excellency congratulated Hon Seymour on becoming the 21st person to take on the role of Deputy Prime Minister of New Zealand.
In supporting the changes to the executive's governing arrangements, the Cabinet Office delivered advice to key figures, and worked with Government House to deliver a brief, yet constitutionally significant event.
Through the smooth transfer of portfolios, the Cabinet Office and Government House helped to publicly demonstrate the strength and dignity of New Zealand's constitutional arrangements.
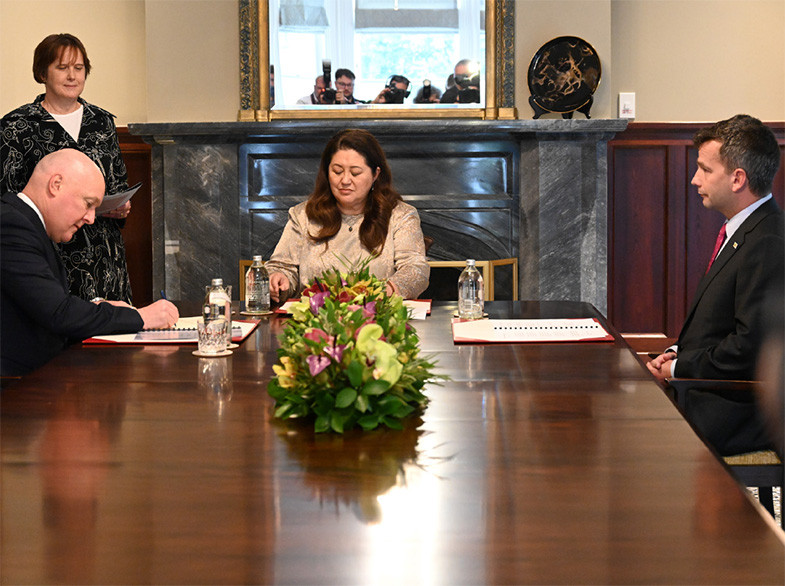
Cabinet Office staff supported the Prime Minister as he advised the Governor-General to appoint Hon David Seymour as Deputy Prime Minister.
Measuring our progress
This outcome is about supporting trust and confidence in government.
Public trust and confidence in government is enhanced when our constitutional structures work well and are seen to do so, and government agencies engage effectively with communities and stakeholders in policy making. This enables those who are affected by a decision or interested in an issue are involved in policy development.
We aim to engage with communities and stakeholders to inform our policy advice in a way that builds trust and confidence.
We support executive government and the Governor-General to fulfil their roles through the provision of advice and support. We measure our success by their satisfaction with the advice and support we provide.
Our performance this year against these measures is summarised in the table below which shows that:
- Ministerial satisfaction - we achieved 4 out of 5 (expectations met most of the time) which was lower than last year. This shows we have further work to do to improve in this area.
- Governor-General Satisfaction - we achieved a rating of 4.4 (expectations met most of the time) out of 5 (expectations always met) from the Governor General in relation to the support we provide her. This is an increase on last year's score.
- Engagement that builds trust and confidence - we are not confident that we can usefully measure this without formally surveying participants in all our engagements. This has proven to be impracticable from a resourcing perspective and the indicator is not able to be reported on.
| Indicator | Desired trend | Baseline 2022/23 |
Progress 2023/24 |
Progress 2024/25 |
Agency contributing to this outcome |
|---|---|---|---|---|---|
| Ministerial satisfaction with the systems and institutions of executive government | → or ↑ | 5.0 | 5.0 | 4 | DPMC |
| Governor-General satisfaction with support provided | → or ↑ | 4.5 | 4.2 | 4.4 | DPMC |
| Our community engagement builds trust and confidence in government | → or ↑ | Indicator under development | Indicator under development | No information | DPMC and NEMA |
| Key to the indicators: ↑ Increase → Maintain | |||||
The way in which we measure these indicators is set out on page 49.
Outcome 3: People living in New Zealand are, and feel, resilient, safe and secure#
What we intended to achieve
- Effective, connected and aligned National Security and Emergency Management systems
- Effective reduction, readiness, response and recovery to national security risks, emergencies and adverse events
- More resilient communities better-placed to respond to, and recover from, threats or emergencies
- Our diverse communities have confidence in the National Security system
DPMC leads and stewards the all-hazards, all-threats National Resilience System. The National Resilience System comprises the various systems (national security, hazards, strategic crisis management and emergency management) that function collectively to improve resilience to our most serious hazards and national security threats.
We work with agencies across government to ensure proactive strategic management of National Risks - hazards and national security threats that could trigger a national level crisis at any time, and cause significant harm to our collective safety, security and prosperity. We support the National Hazards Board and National Security Board in their governance roles.
We lead, coordinate and support the national security community (which form the National Security System) and deliver ‘all source assessments' to safeguard New Zealand's national security interests and drive implementation of the National Security Strategy. We support the Prime Minister in international engagements and advancing our international interests.
NEMA, our departmental agency, leads and coordinates across the emergency management system to reduce risk, and enable the systems and communities to be ready for, able to respond to, and recover from emergencies.
Our time-limited responsibilities included hosting the functional Chief Executive, Cyclone Recovery to provide national-level leadership and cross-government coordination for recovery from the 2023 North Island weather events.
Through this activity, DPMC ensures that the Government's response to risks and building resilience across these systems is effective, connected and aligned, building confidence in the systems and greater capacity to respond.
What we achieved in 2024/25
Improved New Zealand's resilience
In December 2024, Cabinet approved the National Risk and Resilience Framework to strengthen New Zealand's resilience to National Risks and ensure that we have good basic national risk management in place.
Embedded approach to national risk management and building national resilience
New Zealand faces several complex serious hazards and national security threats that could trigger a national level crisis at any time, and cause significant harm to our collective safety, security and prosperity. By managing these National Risks, we support decision-making to focus resources on where they will have the greatest impact.
Throughout the year we worked with agencies to improve their understanding of National Risks. We analysed common drivers and consequences to understand the trends and conditions that accelerate and exacerbate our experience of National Risks when they occur. We also developed:
- maximum credible event scenarios to describe how National Risks could manifest over the next five years
- a low-effort prototype costing tool to provide accurate economic costs of National Risks should they occur, and
- a set of nine key National Risk Management Indicators to help guide prioritisation of effort across National Risks, for the greatest impact.
Through this work we identified priority areas for action (known as ‘resilience priorities') so that we are better prepared ahead of crisis. Working on these areas will lift efforts in areas like national planning and strategic readiness.
Strengthened roles and responsibilities across the National Resilience System
During the year we worked across central government to identify ways to strengthen and clarify roles and responsibilities across the National Resilience System. Our goal is to simplify arrangements and strengthen accountabilities so that people can easily understand the system and DPMC can drive performance and delivery.
Once agreed, central government agencies will have confirmed roles and responsibilities to managing National Risks so that we are proactive and prepared ahead of time, and ready to respond and recover from crises when these occur.
We released the new National Resilience System Handbook in May 2025. This enhances agencies' understanding of the National Resilience System and strengthens readiness for strategic crisis.
Improved understanding and community resilience
Strengthened community resilience to prevent violent extremism
In June 2025, the DIA's Preventing and Countering Violent Extremism Fund concluded its successful three-year programme with a Community of Practice event in Wellington, hosted by DPMC. We brought together nearly 50 representatives from funded initiatives, community organisations, and counter-terrorism agencies to showcase the innovative projects and resources developed under the Fund. The event celebrated achievements, fostered collaboration, and shared lessons learned.
The Fund represented a critical shift towards proactive prevention, working with others to build community resilience to extremist ideologies. As a result, a significant capability gap has been filled, and there is now a broader set of tools and interventions available to address violent extremism and radicalisation effectively.
The impact of this investment goes beyond the life of the Fund, contributing to strengthened partnerships, innovative approaches, and enduring outcomes that support New Zealand's national security and social cohesion.
Commissioned preventing and countering violent extremism research
DPMC contracted the Victoria University of Wellington's Policy Hub to commission research proposals from academics throughout New Zealand on preventing radicalisation to violence. Five research projects have been confirmed:
- Right-Wing Extremism: Exploring the lived experience of people currently or formerly holding extreme right-wing beliefs and/or belonging to extreme right-wing groups and the individuals who love and support them.
- Leveraging gender-based violence and online harm prevention strategies to counter violent extremism: An international review and learning for practice.
- Fostering social belonging in Minecraft-based Interventions.
- Understanding the online ecosystems of Islamic State, its online interaction patterns and radicalisation pathways in the West - A New Zealand Perspective.
- A complex systems approach to preventing and countering violent extremism.
The projects are expected to report their research findings throughout 2025/26 and contribute to expand an evidence base that will inform future decision-making.
Contributed to New Zealanders being confident and secure online
Cyber security is a priority and a core issue in the National Security Strategy. We continued to advance policy work on a range of initiatives to lift New Zealand's cyber capability and resilience, including:
- working with the National Cyber Security Centre and a range of stakeholders to inform our strategic cyber policy settings
- continuing efforts to promote rules and norms on the internet including through attributions of unacceptable state behaviour alongside partners, which are intended to deter malign actors
- working with Australia's Department of Home Affairs to deliver a joint industry cyber security event in Auckland
- working with international partners to maintain lawful access while also protecting personal data, privacy, and security
- supporting the Government's response to a number of significant cyber incidents impacting New Zealand organisations, and
- progressing work to ensure New Zealand is better positioned to manage the national security risks associated with emerging technologies.
Continued to improve New Zealand's resilience to foreign interference
Foreign interference is a core issue in the National Security Strategy. We continued to advance and coordinate policy work and awareness-raising in a range of areas to lift New Zealand's resilience to foreign interference.
We coordinated work on the Counter Foreign Interference work programme and supported the Ministry of Justice to progress legislation to amend the Crimes Act 1961. This aims to strengthen New Zealand's criminal justice response to foreign interference and espionage. We supported the Ministry of Business Innovation and Employment to advance new legislation to deter foreign interference in New Zealand's ground-based space infrastructure.
We increased outreach and awareness-raising about foreign interference risks among priority sectors. We also worked with the Ministry for Ethnic Communities to develop and publish community resilience resources. This supports ethnic communities in New Zealand who may be subject to foreign interference.
Alongside the Public Service Commission, we developed a programme of work to mitigate the risk of Insider Threats in the public service, as a potential vector for foreign interference. We also supported the New Zealand Security and Intelligence Service Protective Security Requirements team to publish a guide to ‘Managing Inward Visits', which helps New Zealand organisations understand, manage, and mitigate the risk of foreign interference and espionage arising from hosting international visitors.
Improved strategic leadership of the national security and emergency management systems
Supported Government's response to the Report of the Government Inquiry into the North Island Severe Weather Events
We worked across central government, with local government Civil Defence and Emergency Management (CDEM) Groups, and with the Iwi Chairs' forum to deliver the Government response Strengthening Disaster Resilience and Emergency Management.
This sets out a plan to transform the emergency management system to consistently implement improvements over time, even as it comes under increasing pressure. It proposed a programme of change across five broad focus areas.
Through NEMA, the Government has now released an implementation and investment roadmap to ensure the programme is implemented in full and at pace.
Continued implementing the National Security Strategy
The National Security Strategy 2023-28 has three priorities, which guide implementation efforts and provide a framework for core issue strategy refreshes:
- acting early to prevent national security threats and build New Zealand's resilience using intelligence, foreign policy and defence tools
- working together across New Zealand and with international partners to foster collective understanding, and
- leading an integrated approach to national security with clear leadership, coordinated intelligence, policy advice, and a system-wide approach to capabilities development.
We continued to lead and implement the Strategy through:
- advice to the National Security Board and Ministers to protect New Zealand from threats that would do us harm, and to advance our national security interests
- convening a cross-government community of practice to embed an integrated approach to addressing national security issues, and
- development of resources to support the acting early priority.
The National Security System has transitioned from focusing on preparing for crises, to also working more proactively to shape and influence our environment, and deter threats where possible.
The initial two-year programme of action, which focused on reforming the national security community and cultivating a public conversation on national security, concludes in August. A refreshed one-year programme of action will be developed in 2025/26.
Supported the Government to respond and recover from nationally impactful events
Hosted the Chief Executive, Cyclone Recovery
The role of the functional Chief Executive, Cyclone Recovery hosted by DPMC through its Cyclone Recovery Unit ended on 30 June 2025.
The Chief Executive, Cyclone Recovery provided strategic oversight and coordination of the policy programme, working with multiple agencies and the regions affected by the North Island weather events.
We supported the Chief Executive, Cyclone Recovery to lead central government's implementation of the Future of Severely Affected Locations (FOSAL) programme.
Local authorities led on designing and delivering categorisation policies, a voluntary buyout scheme for the residential properties with intolerable risk to life from future events, and identifying, planning and delivering interventions for flood and landslide risk mitigation and priority local transport projects.
The Chief Executive, Cyclone Recovery also led implementation of the Whenua Māori and Marae Pathway of FOSAL following categorisation of whenua Māori and marae by local authorities. This involved working directly with whenua Māori landowners and residents on Category 3 land to provide a support package to enable people to move out of harm's way.
Transitioned functions to the Department of Internal Affairs
From 1 July responsibility for central Government oversight of the completion of the remaining activity under the Crown Funding Agreements with Auckland, Tairāwhiti and Hawke's Bay will be undertaken by DIA. DIA will also oversee remaining activity under the Whenua Māori and Marae Relocation Programme. A Crown representative has been appointed to be part of the governance arrangements for the completion of the seven marae.
DPMC is responsible for the Recovery Settings and decision tools, coordinating remaining work on Orders in Council and completion of any accountability requirements.
Further information on supporting Government to respond and recover from nationally-impactful events can be found in NEMA's Annual Report 2024/25 on pages 31 to 44.
Key achievements in 2024/25:
- As at 27 June 2025, the Hawke's Bay Region completed its voluntary buyout process, with 151 agreements settled, with Tairāwhiti estimated to finish with 56 buyouts. Auckland Council completed its property categorisation and made voluntary buyout offers to 848 of the 1,193 property owners affected. It expects to have completed its voluntary buyout process by the end of December 2025.
- Masterton and Tauranga had a small number of properties to buy out. Tauranga completed its process and settled with three property owners. Masterton had nine buyouts for which offers have been accepted and two relocations that will be completed by October 2025.
- 54 Project Delivery Plans and associated funding was approved for local transport and risk mitigation projects across Auckland, Tairāwhiti and Hawke's Bay. The majority of the local transport projects will be completed by the end of 2026. Across a few North Island regions 34 smaller risk mitigation projects were approved for completion by December 2025.
- Councils in Tairāwhiti and Hawke's Bay identified seven marae and 24 residential whenua Māori as having an intolerable risk to life from a future event. Five marae in Tairāwhiti and two in Hawke's Bay have signed Relationship and Funding Agreements with the Crown, have secured new safe sites and are undertaking planning and design activities.
- Agreements have been signed by all 24 residential whenua Māori owners. This includes one agreement that covers eight properties to establish a papakāianga. Demolition of residential structures is well progressed, with the last five properties to have work completed between July and September 2025, either by the Crown or the whenua owners.
- There were 19 Orders in Council to amend relevant legislation to allow Councils to speed up urgent works and a further Order regarding the Wairoa Flood Protection Project to go ahead is working its way through the process.
- A suite of recovery settings with tools to support early ministerial decision making after a nationally significant natural event were developed and approved.
Case Study - Connecting New Zealand’s approach to space weather hazard
Space weather - which refers to occasional bursts of solar energy released by the sun - is one of the most significant hazards we face. Space weather events have the potential to cause catastrophic impacts globally, including for New Zealand. This could include extended disruptions to our critical infrastructure and essential services - notably power, telecommunications, transport and finance - and interruptions to global supply chains.
In 2024/25 the National Resilience System, led by DPMC working closely with NEMA and the Ministry of Business, Innovation and Employment, stepped up activity to prepare for this hazard ahead of the forecast ‘solar maximum' - a period of heightened solar activity which makes space weather events more likely.
In July 2024 DPMC convened a group of experts across government, industry and academia to assess the likely implications for New Zealand from a severe space weather event. Participants worked through a hypothetical maximum credible event (‘realistic worst-case') scenario to identify the range of impacts we need to prepare for and consider what we can do ahead of time to prevent or reduce these impacts.
The findings were presented to the National Hazards Board - a collective group of Chief Executives responsible for oversight of hazards including space weather - alongside opportunities to strengthen our national resilience. This included advice on how to best protect our key critical infrastructure assets.
This work was a key step in raising awareness of this hazard and has helped shape further efforts inside and outside government, including NEMA's development of New Zealand's first National Space Weather Response Plan and ongoing exercises to test and strengthen our preparedness for a future space weather event.
Refer to page 36 in the NEMA Annual Report 2024/25 for information about its role in responding to space weather events.
Measuring our progress
This outcome is about ensuring that people living in New Zealand are, and feel, resilient, safe and secure.
Our contribution to this outcome relates to our leadership of the National Resilience System (and the systems that comprise this) by DPMC and NEMA. When working well, National Risks are identified and managed so that issues are avoided or at least their impact minimised, the system is ready and able to respond if an emergency occurs, and our response works well for the people and communities impacted at the time and during recovery.
These systems are made up of many central and local agencies as well as communities themselves. Our role is to support those leading and working in these systems and those who are impacted by them, to do what they need to do. We do this in a range of ways including the development of advice and working across the system to support the agencies and communities.
We measure success through asking those we work with about their satisfaction with the advice and services we provide. We also measure public confidence in government agencies to deal with national security threats and emergencies, and the preparedness of New Zealanders in the event of an emergency.
Our performance this year against these measures is summarised in the table below which shows that:
- Public confidence - the National Risks Public Survey that informs this indicator is now conducted biennially. This survey will be conducted again in 2026, and the result of the 2024 survey is reported below. The 2024 result is sitting at 50 percent which is similar to the last time the survey was run in 2023 and lower than the baseline.
- Ministerial Satisfaction - we achieved 4 (expectations met most of the time) out of 5 (expectations always met) which was the same as last year. This is still below our baseline year showing that we have further work to do to improve satisfaction with leadership of the national resilience, national security and emergency management systems.
- Satisfaction of the agencies we work with - the way we measure our performance for this indicator has changed to better reflect embedding the National Resilience System. In December 2024, Cabinet agreed that agencies work with DPMC to provide coordinated cross-agency advice on strategic risk management gaps or opportunities, through the activities listed in the National Risk and Resilience Framework. We consider the results for prior years remain comparable given DPMC's enduring role has not changed and the inclusion of a broader range of agencies in the survey is not material.
We achieved a rating of 3.8 (expectations met about half of the time) out of 5 (expectations always met) from the Chief Executives of the agencies that make up the National Security Board and National Hazards Board who provide governance to the National Resilience System. The feedback noted the strong leadership, professionalism, and coordination in crisis management and national security. Areas for improvement include adopting a more system-wide focus, improved consultation and enhanced transparency in decision-making, and strengthening the strategic focus within the National Resilience System.
- Readiness in New Zealand communities - we have maintained a higher level of knowledge of correct action to take during a long or strong earthquake near the coast, compared with the baseline. Although overall preparedness has risen from last year, it remains slightly below our baseline year. Results in these areas are linked to the occurrence of emergency events, as well as promotional activities over which we have more control.
| Indicator | Desired trend | Baseline 2022/23 |
Progress 2023/24 |
Progress 2024/25 |
Agency contributing to this outcome |
|---|---|---|---|---|---|
| Public confidence in government agencies to deal with national security threats and emergencies | → or ↑ | 53% | 50% (Biennial survey) |
DPMC and NEMA | |
| Ministerial satisfaction with leadership of the National Security and Emergency Management Systems | → or ↑ | 4.5 | 4 | 4 | DPMC and NEMA |
| National security agencies are satisfied with the leadership of the national security system | ↑ | 3.3 | 3.8 | 3.8 | DPMC |
| New Zealanders who: | |||||
|
→ or ↑ | 43% | 38% | 40% | NEMA |
|
→ or ↑ | 64% | 73% | 72% | NEMA |
| Key to the indicators: ↑ Increase → Maintain | |||||
The way in which we measure these indicators is set out on page 50.
Outcome: An influential, agile, high-performing organisation in which our people feel empowered, valued and engaged#
DPMC advances an ambitious, resilient and well-governed New Zealand. To achieve this we require an influential, agile, high-performing organisation in which our people feel empowered, valued and engaged.
Contemporary, responsive and future-focused way of working (tāera mahi)
We are regularly called upon to deliver on new and emerging government priorities and risks. This means we need to be a responsive, scalable, learning organisation supported by an effective operating model, flexible systems and policies which empower our people to deliver at pace.
Throughout the year we worked closely with other central agencies to lead the public service and deliver meaningful results for New Zealanders. The Delivery Unit within our Policy Advisory Group has established itself, working with central agencies to enhance the integration and reporting of Government Targets and provide insights and intervention to support delivery.
With the conclusion of the functional Chief Executive, Cyclone Recovery, residual work to support recovery efforts across New Zealand will rest with DPMC and DIA. In addition, we began the process to facilitate the transition of NEMA to DIA, to better align with its operational focus. We also consulted on a future structure for DPMC to strengthen our ability to provide robust, free and frank policy advice to the Prime Minister. These changes enhance organisational clarity and strengthen DPMC's ability to deliver its core functions, ensuring we remain effective in supporting the Prime Minister, Cabinet and the Governor-General.
Positive and safe work environment (wāhi mahi)
Positive and safe workplaces improve wellbeing, productivity and performance. Our business units had shared internal priorities that focused on improving our te ao Māori capability, including te reo Māori and Whāinga Amorangi actions, and fostering a positive and inclusive wāhi mahi (work environment).
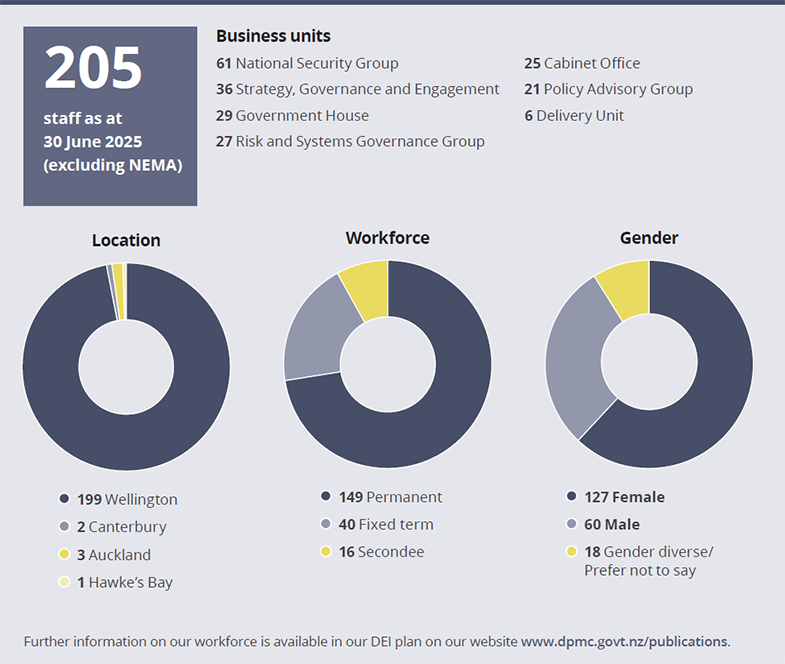
In October 2024, DPMC released an updated integrated strategy to achieve our diversity, equity, and inclusion (DEI) goals, including addressing gender and ethnicity pay gaps. This aligns with our obligation to promote, develop, and monitor equal employment opportunities. DEI plans for DPMC and NEMA are available on our website at Publications.
Over the past year, DPMC has continued to provide safe work environments, wellbeing initiatives, and engage staff in the identification and management of health and safety risks. Progress has been made to better enable the identification of trends and ensure a continuous improvement approach, including a refresh of our Health and Safety framework, implementing an automated health and safety tool to streamline reporting and monitoring, and redesigning our internal health and safety information for staff.
Gender balanced leadership[2]
Women occupied 67 percent of all leader roles (28 of 42) and 74 percent of Tiers 2 and 3. This is similar to last year.
Gender pay gap
Because our workforce is relatively small, a shift in just one or two employees can have a significant positive or negative effect on any percentage change reported.
2024/25 mean: 8.7 percent (Target: >10 percent) (2023/24: 9.9 percent)
Our gender pay gap decreased by 1.2 percentage points at year end 2024/25.
2024/25 median: 23.7 percent (2023/24: 19.7 percent)
Our median gender pay gap has increased 4 percentage points in the past year. The median is higher than the mean due to a much greater proportion of women in lower pay bands.
Skilled, energised and high-performing workforce (ohu mahi)
Our aim is to ensure we have the right people, in the right roles, at the right time, with the appropriate skills and capabilities needed. This includes permanent, fixed term and seconded public servants that are highly skilled and aligned with the department's objectives.
Recognising that strong leadership and an engaged workforce are at the heart of delivering excellence, we introduced a range of initiatives to support both leaders and teams. This included launching a people leader eLearning module for leaders new to DPMC, delivering a masterclass tailored to navigating change and uncertainty, as well as refreshing our leadership, te ao Māori and cultural competency learning and development hubs on our intranet. We also refined our performance management processes to support the identification of talent, promote opportunities for growth, and strengthen the alignment between individual, team, and organisational objectives.
During the year we introduced in partnership with the Treasury a generative artificial intelligence tool for use to streamline our work and increase efficiency within a secure environment.
Our people
Measuring our progress
The table below sets out the indicators we use to monitor our progress towards being an influential, agile, high-performing organisation in which our people feel empowered, valued and engaged. For this year's reporting we have used the job satisfaction measure and three Māori Crown capability measures (as a combined metric) from Te Taunaki Public Service Census conducted in March 2025, to report on staff satisfaction and the te ao Māori capability of our workforce. This replaces the internal staff survey which was not run in 2024/25.
Our performance this year shows that:
- overall the number of employee-led networks in DPMC and NEMA has risen although level of activity and engagement varies. These networks are an indication of staff engagement and also contribute towards an organisational culture of inclusion
- te ao Māori capability in both agencies has improved significantly since 2021, although we recognise we still have more to do and remain committed to this journey
- the diversity of our workforce remained relatively static, increasing the diversity of our workforce is a longer-term strategy
- DPMC's gender pay gap decreased by 6.8 percentage points, while NEMA’s increased by 3.2 percentage points when compared to the 2022/23 baseline. Due to both agencies being relatively small, some Gender Pay Gap volatility can be experienced. DPMC and NEMA have similar DEI plans that establish the longer-term strategy and supporting activity to achieve their targets
- staff satisfaction at DPMC has declined since 2021, prompting the implementation of an action plan to enhance organisational culture, strengthen capability, and reduce barriers to high performance. NEMA staff satisfaction has increased since 2021
- greenhouse gas emissions for DPMC are slightly less than baseline year, while NEMA's has increased. Reducing emissions remains a focus for both DPMC and NEMA.
| Indicator | Desired trend | Baseline 2022/23 |
Progress 2023/24 |
Progress 2024/25 |
|
|---|---|---|---|---|---|
| Employee-led networks | → or ↑ | DPMC NEMA |
5 5 |
5 8 |
6 8 |
| Te ao Māori capability of our workforce (percentage) | ↑ | DPMC NEMA |
60 66 |
- - |
71 74 |
| Diversity of workforce (percentage)[3] | ↑ | DPMC NEMA |
13.5 14.3 |
14.1 12.4 |
14.5 15.4 |
| Gender pay gap (percentage) | ↓ | DPMC NEMA |
15.5 4.5 |
9.9 3.6 |
8.7 7.7 |
| Staff satisfaction (percentage)3 | ↑ | DPMC NEMA |
74 52 |
- - |
63 67 |
Greenhouse gas emissions (Tonnes of Carbon Dioxide Equivalent Units) |
↓ | DPMC NEMA |
1,159.1 467.1 |
797.2 290.8 |
930.09 313.53 |
| Key to the indicators: ↑ Increase → Maintain ↓ Decrease | |||||
Notes
- [1] The baseline for this indicator, consisting of three data points, is set from the 2023/24 year due to a lag in data availability.
- [2] For information on NEMA's DEI metrics, refer to the NEMA Annual Report on pages 31 to 44.
- [3] The baseline information for the staff satisfaction and Te ao Māori capability measures was obtained in March 2021 through Te Taunaki Census. As this is a different methodology the results are restated in the 2022/23 column. The information reported in 2023/24 used a different methodology and is therefore removed.
Our operations #
Ā mātou whakahaere mahi
Our key work programmes, services and activities are set out in Our Outcomes on pages 7 to 21. Additionally, we report against our performance on appropriations on pages 55 to 62. Together these provide detailed information on what we set out to do, and how well we achieved our ambition.
Implementing the Government's priorities #
Government Targets
Our role in contributing to the development and delivery of the Government Targets is set out in Outcome One on pages 7 to 10. Information on the Targets can be found at Government Targets.
Other priorities
The Prime Minister expects DPMC to be a more purposeful and impactful organisation focused on its core responsibilities, including its role as a central agency. Information on our work to strengthen and streamline DPMC can be found on pages 22 to 24.
Significant Budget decisions
Through Budget 2024 and Budget 2025 DPMC received time-limited funding for its central agency and national security, risk and resilience functions, and for cyclone recovery initiatives. Significant Budget initiatives are published in the Minister of Finance's Summary of Initiatives, available on the Treasury website. Information on other significant funding decisions taken during the year is available in the Supplementary and Estimates of Appropriations for Vote Prime Minister and Cabinet. The table below provides information on these significant Budget initiatives and related performance information:
| Initiative | Budget year | Intended result | Performance information |
|---|---|---|---|
| Baseline stabilisation of core functions | 2024 | Contribute to a range of cost pressures experienced across the department | Outcomes 1-3 on pages 7 to 21 Reporting Against our Appropriations on pages 56 to 59 |
| Central agency, national security, risk and resilience | 2025 | Continue funding for one year as an interim measure pending consideration in future Budgets | |
| Recovery from the North Island weather events | 2024 and 2025 |
Several initiatives for contributions to costs of regional and iwi recovery from the 2023 North Island weather events | Outcome 3 on pages 16 to 21 Report on Non-departmental appropriations on pages 107 to 109 |
Baseline savings
DPMC's baseline was reduced by $3.244 million in 2024/25 because of the Budget 2024 Initial Baseline Exercise. We achieved the savings through:
- disestablishment of the Strategy Unit
- reduction in staffing across other business units
- consolidation of our property footprint and reducing secure office space
- reduction in expenditure in consultancy and external legal advice budgets
- reduction in cross-agency cyber security programme funding
- shift from annual to biennial National Risks Public Survey, and
- reduction in conference hosting sponsorship.
These savings included non-departmental expenditure baseline savings of $0.825 million through reducing a planned increase in funding for research for preventing and countering violent extremism.
All information is set out in the Summary of Initiatives for Budget 2024 which can be found at Summary of Initiatives in Budget 2024.
Reduction in expenditure on contractors and consultants
DPMC achieved a reduction of $1.232 million in 2024/25. This compares with expenditure in past years as shown below (this is inclusive of contractors and consultants who supported the Chief Executive, Cyclone Recovery):
| 2022/23 $000 |
% workforce expenditure |
2023/24 $000 |
% workforce expenditure |
2024/25 $000 |
% workforce expenditure |
|---|---|---|---|---|---|
| 3,098 | 7 | 2,165 | 5 | 933 | 2 |
Critical assets performance #
The assets we use comprise intangible assets, including acquired and internally generated software as well as property, plant and equipment assets. These assets include both assets owned by the Department as well as software provided as a service.
Strong asset and investment management practices are critical to our long-term success as not only are these a key enabler for all our services, they are also vital in achieving value for money.
However, while all assets are important, some service areas use assets that are service critical. A service critical asset is defined as an asset which, if damaged or destroyed, is likely to have a significantly adverse impact on the delivery of the agency's services. For DPMC these areas include:
- Support to Cabinet and Cabinet committees: Software is used to securely support Cabinet and Cabinet committee processes. The performance indicator is set out below.
- Tsunami Monitoring and Detection Network: The Deep-ocean Assessment and Monitoring of Tsunami (DART) buoys' network improves New Zealand's ability to monitor, detect and issue warnings about tsunami. The asset performance indicator is set out on page 61.
| Indicator Category |
Service Area | Indicator | Result 2023/24 |
Result 2024/25 |
|---|---|---|---|---|
| Availability | Support to Cabinet and Cabinet committees | Proportion of time that CabNet is available for use (outside of scheduled maintenance windows) | 100% | 100% |
Māori Crown relations capability #
Our te reo Māori plan, shared across DPMC and NEMA, supports te reo Māori as a taonga in te ao Māori. The plan is informed by Maihi Karauna, the Crown's Strategy for Māori Language Revitalisation 2019-2023. Our plan is structured around the three outcome areas of the strategy: Aotearoatanga - nationhood, Mātauranga - knowledge and skills, and Hononga - engagement.
Our shared DPMC and NEMA Whāinga Amorangi plan is our starting point for building our internal capability. Our aspiration will continue to grow as we make progress on this shared kaupapa. The plan focuses on two capability areas - New Zealand history/Treaty of Waitangi literacy and te reo Māori.
We continue to enhance our understanding of our responsibilities under the Treaty of Waitangi and remain committed to this ongoing journey. Insights from Te Taunaki Public Service Census highlight positive progress. The proportion of staff who report feeling comfortable supporting tikanga Māori has risen from 63% in 2021 to 75% in 2025. Similarly, staff understanding of how Treaty of Waitangi responsibilities apply to their work has increased from 55% in 2021 to 67% in 2025. Additionally, the percentage of staff who feel supported to improve their te reo Māori skills has grown from 62% in 2021 to 70% in 2025.
Treaty settlement commitments #
He Korowai Whakamana
Reporting on commitments
He Korowai Whakamana, a Cabinet agreed framework, enhances the Crown's accountability for its Treaty settlement commitments. He Korowai Whakamana requires core Crown agencies to record and track the status, and report annually on, their settlement commitments. DPMC is one of the agencies responsible for settlement commitments. DPMC is responsible for tracking the Crown's overall progress with delivering on Treaty settlement commitments.
In 2023, core Crown agencies used Te Haeata - the Settlement Portal to record whether each of their commitments is complete, on track, yet to be triggered or has delivery issues.
As part of He Korowai Whakamana, core Crown agencies will report on the status of their settlement commitments from financial year 2023/24.
Status of DPMC commitments
As a supporting agency responsible for negotiating the settlement of historical Treaty of Waitangi claims, we are responsible for a variety of settlement commitments. This includes commitments relating to participation arrangements over natural resources, relationship redress, vesting and gift back.
As at 30 June 2024, DPMC was responsible for 26 Treaty settlement commitments. As at 30 June 2025 there has been no change in the status of these commitments, summarised below:

Carbon Neutral Government Programme #

In response to the Government's announcement of a Climate Emergency in 2020, DPMC has actively participated in the Carbon Neutral Government Programme (CNGP). The programme aims to accelerate emissions reductions across the public sector and offset remaining gross emissions from 2025 to achieve carbon neutrality.
DPMC has made substantial progress in meeting our CNGP requirements. We worked with Toitū EnviroCare (Enviro Mark Solutions Limited) to ascertain our commitments and have measured and verified departmental emissions for each year from 1 July 2019 through to 30 June 2025.
Independent verification
We achieved Toitū Carbonreduce Certification in June 2025 and will continue to measure, manage, and reduce our carbon emission in line with ISO14064-1:2018. We have restated previous annual emissions to reflect the change in emissions factors as issued by the Ministry for the Environment.
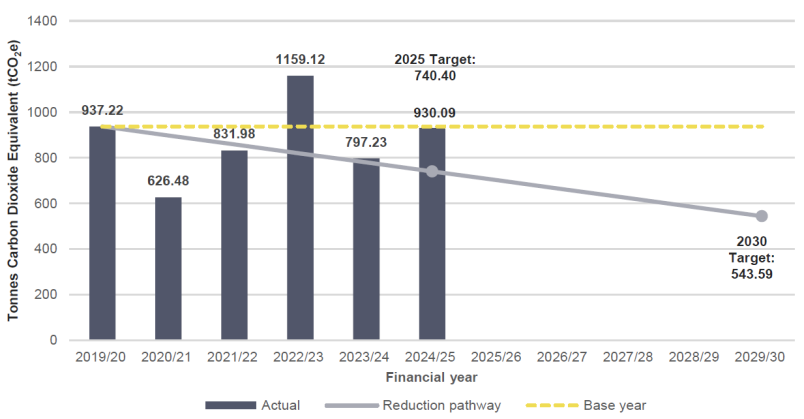
In 2019/20 the base year, we emitted 937.22 tonnes of carbon dioxide equivalent (tCO2e). In the following years our operations were impacted by COVID-19 with 626.48 tCO2e emitted in 2020/21, and 1,159.12 tCO2e emitted in 2022/23. This year we emitted less than our baseline but more than 797.23 tCO2e in 2023/24.
Our performance is 20 percentage points or 189.69 tCO2e above the 2025 Target.
Emissions relating to our role supporting the Governor-General, and the remainder of DPMC are combined to obtain total annual emissions as shown below:
Total annual emissions
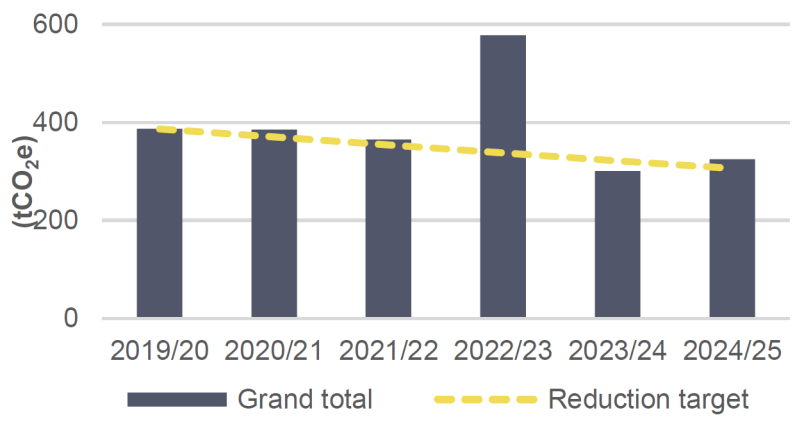
Total annual emissions: Government House (GH)
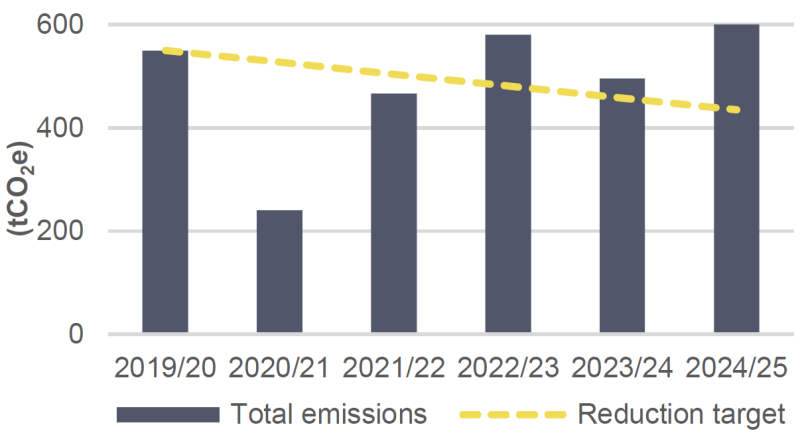
Total annual emissions: DPMC ex-GH
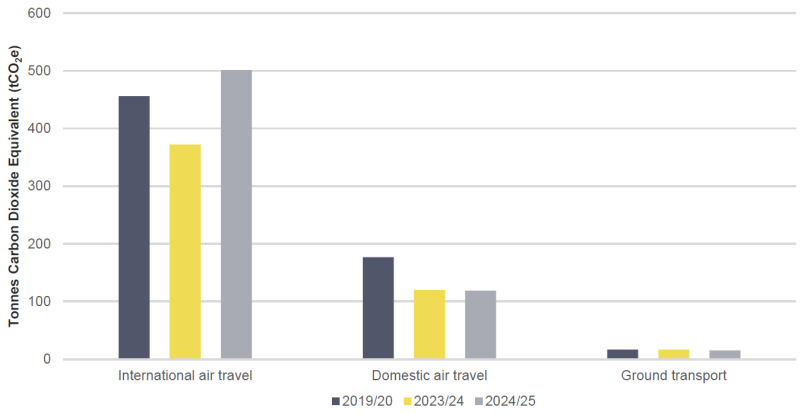
The table below shows our greenhouse gas emissions profile broken down by the four CNGP Categories[4] applicable to DPMC. Emissions from transportation (Category 3) are the largest contributor to greenhouse gas emissions, with air travel being the primary emissions source (see chart below).
Emissions profile broken down by category, scope and total annual emissions[5]
| Category | Scope | 2019/20 (tCO2e) |
2023/24 (tCO2e) |
2024/25 (tCO2e) |
|
|---|---|---|---|---|---|
| 1 | Direct emissions
|
Scope 1 | 124.73 | 153.29 | 97.43 |
| 2 | Indirect emissions from imported energy5
|
Scope 2 | 91.38 | 73.65 | 101.88 |
| 3 | Indirect emissions from transportation
|
Scope 3 | 682.35 | 534.05 | 698.30 |
| 4 | Indirect emissions from products and services used by organisation
|
Scope 3 | 36.76 | 36.24 | 32.48 |
| 5 | Indirect emissions associated with the use of products and services from the organisation | Scope 3 | 0 | 0 | 0 |
| 6 | Indirect emissions from other sources | Scope 3 | 0 | 0 | 0 |
| Total Gross Emissions (tco2e) | 937.22 | 797.23 | 930.09 | ||
| Change in gross emissions from previous financial year | -31.22% | 16.66% | |||
| Change in gross emissions since base year | -14.94% | -0.76% | |||
Total transportation emissions (tCO2e) 2024/25 compared to base year and prior year[6]
Emissions intensity by full-time equivalent (FTE) and expenditure
Since the base year, our work programme and number of staff have increased. Despite this growth, we decreased our emissions intensity while continuing to deliver impactful work. Our emissions intensity per FTE has decreased from 4.71 tCO2e to 4.34 tCO2e per FTE staff members as shown below.
FTE and Expenditure for 2024/25 compared to base year and prior year
| KPI | 2019/20 | 2023/24 | 2024/25 |
|---|---|---|---|
| FTEs | 198.99 | 258.60 | 214.50 |
| Expenditure ($m)[7] | 58.332 | 55.131 | |
| Emissions intensity | |||
| Total gross emissions per FTE (tCO2e) |
4.71 | 3.08 | 4.34 |
| Total gross emissions per million dollars of expenditure (tCO2e) |
13.67 | 16.87 |
Reducing our emissions
In June 2022, we launched our Emissions Reduction Plan for the following three years. This sets out our intentions and an action-based pathway for reducing emissions in line with the Government's commitment to keep global warming to less than 1.5 degrees of warming. These actions include a focus on facilitating climate positive behaviours in our work.
As part of our obligations, we have committed to the following targets:
- 2025 target: Gross emission (all Categories) to be no more than 740.40 tCO2e - a 21 percent reduction in gross emission compared to base year.
- 2030 target: Gross emission (all Categories) to be no more than 543.59 tCO2e - a 42 percent reduction in gross emission compared to base year.
Our reduction plan and future reporting
Our Emissions Reduction Plan enables us to reduce emissions where possible through understanding and reviewing our operation and business travel behaviours. This Plan uses several behavioural and investment levers to achieve our emissions reduction commitments and CNGP offsetting requirements. This includes setting business group emissions reduction targets as part of annual business planning, and reporting on progress to the Executive Leadership Team.
Improving our data
An important part of our Emissions Reduction Plan is a commitment to improving data quality and understanding how we can reduce emissions. Our current emissions reporting indicates a high concentration in air travel. This year we continue to analyse our business-related travel and make available necessary insights to foster climate positive behaviours in our engagement with both domestic and international partners.
Notes
- [4] The terminology of ‘categories' is used in ISO 14064-1:2018, to add further definition to the different ‘scopes' that are used in the Greenhouse Gas Protocol. Scope 1 and 2 are the same as categories 1 and 2, respectively. Scope 3 includes categories 3, 4, 5 and 6.
- [5] In May 2023, the Ministry for the Environment issued an update in the electricity transmission and distribution emissions factors. This was necessary to ensure that the CNGP remain aligned with leading science and is up to date with the latest information available. As required by the CNGP we updated previous years to reflect this change.
- [6] Ground transport figures have been restated due to changes in emissions factors.
- [7] Expenditure data is only available from 2021/22.
National Emergency Management Agency Annual Report 2024/25#
Te Rākau Whakamarumaru Pūrongo-ā-tau 2024/25

The National Emergency Management Agency (NEMA) is charged with supporting communities to reduce the impact of emergencies across all hazards and risks, and to better respond to, and recover from, emergencies when they happen.
Introduction from the Chief Executive#
Kupu whakataki a te Tumu Whakarae

This year the National Emergency Management Agency (NEMA) has focused on putting the elements in place to deliver the stronger emergency management system the Government and New Zealanders expect.
In October 2024, the Government released its response to the Report of the Government Inquiry into the Response to the North Island Severe Weather Events. The Government response outlined the direction of travel for a five-year work programme to strengthen the emergency management system.
Subsequently, we engaged with stakeholders to develop a Roadmap for investment and implementation that identified the right actions and a realistic timeframe. Cabinet has agreed to the Roadmap in principle, subject to further policy work, the passage of enabling legislation, and availability of new funding through future Budgets. Several initiatives within the Roadmap have progressed and represent a significant programme of work for NEMA that will continue into 2025/26 and beyond.
Legislative reform is needed to strengthen the emergency management system and developing a new Emergency Management Bill is a continued priority for NEMA. In April and May, we invited submissions on options to strengthen New Zealand's overarching emergency management legislation. 324 substantive submissions were received, demonstrating the public interest in ensuring the legislation is fit-for-purpose.
Alongside the work to deliver the Government response to the North Island Severe Weather Events, we completed key work to strengthen national operational readiness.
In December 2024 we issued New Zealand's first National Space Weather Response Plan. Responding effectively to a significant space weather event will require complex decisions - balancing short-term disruptions to protect critical infrastructure from potentially devastating long-term impacts.
In February 2025 we published the Catastrophic Event Handbook. It is hazard-agnostic and provides a blueprint to respond to the most severe disasters we face, such as a large Alpine Fault earthquake. It is scalable and allows for hazard-specific plans to be developed under this framework. The Handbook is the start of a journey - it is a living plan that will continue to be developed and refined over the coming years.
In May 2025, we issued an updated Tsunami Evacuation Director's Guideline. The guideline sets the new nationally consistent approach for public-facing tsunami evacuation zones: one Blue Zone. This makes tsunami evacuation much simpler, especially for local-source tsunami when risk to life is highest and there is not enough time for an official warning.
NEMA's mandate and work programme is broad, and this annual report outlines other activities and actions taken to lead and support the emergency management system to reduce risks and prepare communities to be ready to respond and able to recover. I would like to acknowledge NEMA staff for their efforts and commitment to building a stronger emergency management system that can meet the challenges New Zealand faces.
Statement of Responsibility
I am responsible, as Chief Executive of the National Emergency Management Agency Te Rākau Whakamarumaru, for the accuracy of any end-of-year performance information prepared by NEMA, whether or not that information is included in the Annual Report.
Dave Gawn
Chief Executive
National Emergency Management Agency
Who we are and what we do #
Ko wai mātou, he aha ā mātou mahi
Overview of our Agency
NEMA is one part of a much larger emergency management system that works to build a safe Aotearoa New Zealand. Our role is to lead and support the emergency management system to ensure risks are reduced, and communities are ready to respond and able to recover. NEMA's strategic outcomes and priorities are outlined in our Strategic Plan on page 35.
NEMA leads the national emergency management response to and recovery from geological, meteorological and infrastructure failure emergencies, and supports other lead agencies in the response and recovery of other hazard events. NEMA's role as lead or support agency depends on the scale and nature of the emergency.
For many national emergencies, NEMA leads the coordination of central government's response and recovery functions. Many emergency events happen at local or regional level; during these, NEMA supports regional Civil Defence Emergency Management (CDEM) Groups and, where necessary, coordinates national-level support.
NEMA works with a range of organisations and bodies, including central and local government, communities, iwi Māori, emergency services, lifeline utilities, private sector organisations, education providers, research and science organisations, non-government organisations and businesses to ensure coordinated, integrated and effective response and recovery.
NEMA holds international relationships with emergency management counterparts overseas and engages on emergency management best practice and operational matters.
NEMA's work is underpinned by the Civil Defence Emergency Management Act (CDEM Act) 2002, the National Disaster Resilience Strategy, the Sendai Framework for Disaster Risk Reduction 2015-2030, and the National CDEM Plan.
Our numbers at a glance#
| 6th NEMA was rated as 6th most trusted agency in 2025 (out of 57 public sector agencies) in the 2025 Public Sector Reputation Index. | |
| 676,000+ people were registered for the 2024 ShakeOut earthquake drill. |
24,680 people are registered with Takatū, our online learning management system, 3,614 more than last year. |
| $4.51 million total payments were made last year under all appropriations managed by NEMA for Cyclone Gabrielle. |
$11.73 million total payments were made last year by NEMA for all events (including Cyclone Gabrielle). |
| 1,000+ learners have attended the Knowledge of Coordinated Incident Management System (CIMS) courses, held across Auckland, Wellington, Christchurch and online. |
76 uses of the Emergency Mobile Alert system by NEMA, New Zealand Police, Fire and Emergency New Zealand, and Civil Defence Emergency Management Groups. |
Our year at a glance#
Te tau kua hipa
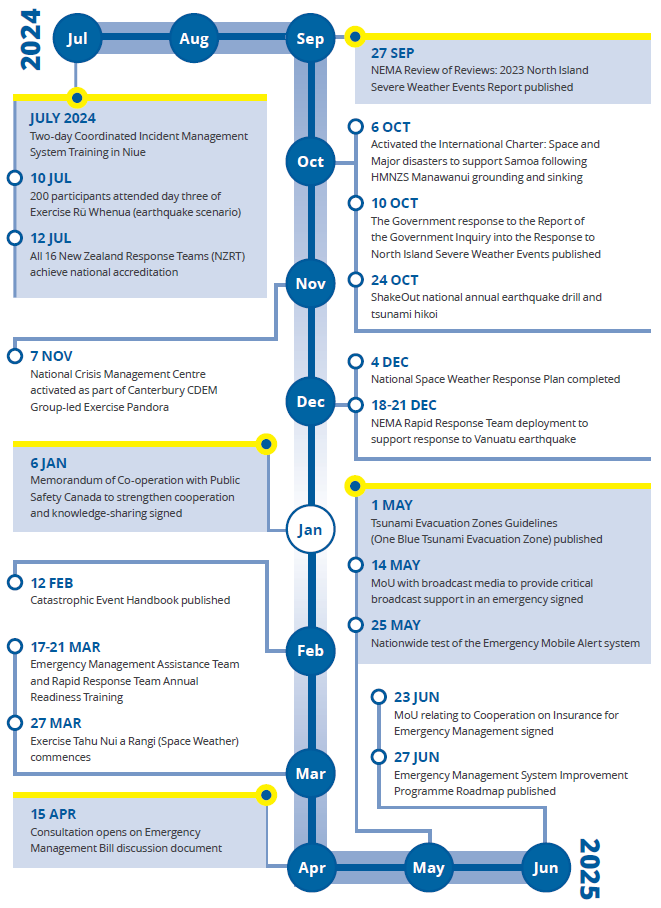
Our performance#
Ko tā mātou mahi
NEMA contributes to DPMC's Strategic Intentions 2023/24 to 2026/27 Outcome Three “People living in New Zealand are, and feel resilient, safe and secure”. Our Strategic Plan shows how we deliver on Outcome Three.
What we Intended to Achieve
- Effective reduction, readiness, response and recovery to national emergencies and adverse events.
- Communities are more resilient, allowing them to be better placed to respond to and recover from threats or emergencies.
Reduced Emergency Impacts
“The impacts of emergencies on people, the economy and the environment are reduced, and communities experience equitable outcomes”.
Resilient communities
We supported impacted regions in their response and recovery efforts, aiming to bring about the immediate, medium, and long-term regeneration and enhancement of communities following an emergency. For example, in 2024/25, NEMA supported nine regions in the “60/40 claims process”[8] and by surging in staff, both remotely and in person to Emergency Coordination Centres during several states of local emergency. Regional Emergency Management Advisors and Emergency Management Assistant Team (EMAT) surge staff deployed to support the Dunedin flood event in October 2024. We also delivered Annual Readiness Training to 35 sector staff to support domestic and international deployments.
We partnered with the MetService, enhancing public education on severe weather through their channels. We also delivered the annual New Zealand ShakeOut 2024, a nationwide campaign on earthquake and tsunami readiness, resulting in 676,000 signed participants and a strong response across the country.
In May 2025, NEMA signed a Memorandum of Understanding (MoU) with broadcast media which will provide broadcast support before and during civil defence emergencies. When activated in an emergency response, NEMA can mobilise support to broadcast or amplify critical messages above and beyond normal news programming. The critical messages can be delivered at a national or regional level, depending on the nature of the emergency.
The MoU also sees Māori broadcast media joining the arrangement, reflecting the vital role Whakaata Māori and iwi radio stations play in disseminating emergency information. In an emergency response, it is vital that people have the information they need to stay safe.
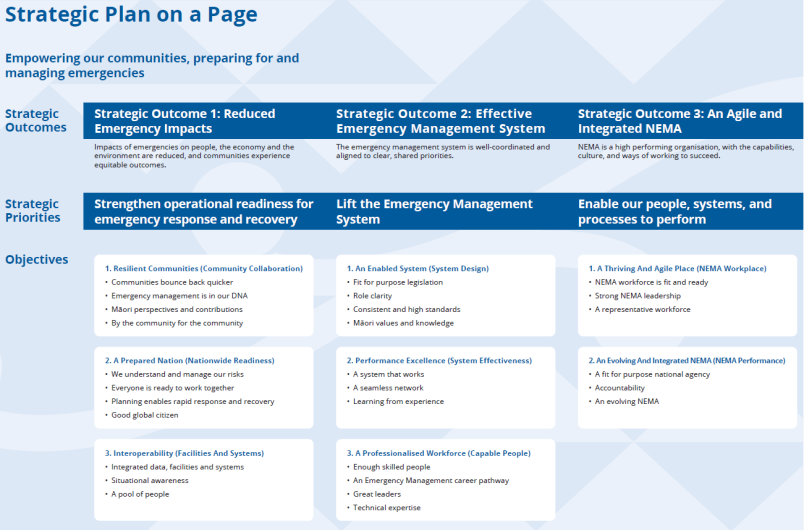
Systems are integrated and work together - Interoperability
In January 2025, work started on the design of a new National Crisis Management Centre (NCMC). The new facility will be housed within the new Museum Street building and is scheduled to be operational in late 2026. We also implemented remote access capability for the NCMC network in June 2025. This functionality can be deployed if needed as an interim measure to improve the flexibility and resiliency of the NCMC.
A prepared nation
Our 24/7 Monitoring, Alerting and Reporting (MAR) Centre has continued to enhance the services it provides through improved processes, and ongoing training and exercising, particularly for tsunami warnings. In 2024/25 NEMA assessed 53 earthquakes (30 regional and 23 local) for potential tsunami risk.
In July 2024, we hosted a nationwide recovery forum (day three of national exercise Rū Whenua), to discuss the importance of pre-disaster recovery planning. There were 200 participants representing a diverse range of sectors including public, private and not-for-profit sectors, iwi Māori, international attendees, and members of academia.
We deployed the NEMA Rapid Response Team to Vanuatu to support the response following the magnitude 7.3 earthquake. We also advised on the New Zealand deployment in response to the landslide in Enga Province, Papua New Guinea. The team also supported the response, for Tropical Cyclone Seru and Tropical Cyclone Rae. Two NEMA staff are currently posted into Pacific Island National Disaster Management Offices in Samoa and Tonga to work alongside their staff to strengthen their emergency management capability and capacity.
NEMA works to ensure New Zealand is a nation prepared for emergencies through national level planning. In December 2024 we completed the National Space Weather Response Plan and the Catastrophic Event Handbook. The National Space Weather Response Plan supports preparedness and response to a space weather event that could disrupt critical infrastructure and essential services, potentially causing major impacts on communities. The Catastrophic Event Handbook equips us with a hazard-agnostic framework to address catastrophic events.
Case Study - Catastrophic Event Handbook
In 2022, NEMA launched the Catastrophic Readiness Programme to strengthen disaster preparedness in New Zealand. This initiative brought together emergency management experts to improve coordination across government and develop guidelines for critical tasks, focusing on logistics, mass relief, international assistance and intelligence. These efforts resulted in the Catastrophic Event Handbook. A collaboratively developed framework designed to enhance whole-of-government responses to catastrophic events.
The Handbook offers a hazard-agnostic approach addressing the operational and recovery impacts of catastrophic events. It outlines initial response actions, transition to recovery, and includes roles for non-governmental organisations, auxiliary entities and private sector partners.
Key features of the Handbook include:
- improving emergency management readiness across the system
- providing a framework for national coordination
- addressing readiness gaps , and
- outlining initial recovery actions.
Designed with scalability and flexibility, the Handbook supports cohesive disaster response at a national level. It also aims to uphold public trust by reducing harm to people and property during extreme events. The Handbook will continue to be refined as stakeholders identify find areas for improvement and ways to align planning efforts.
NEMA's ongoing focus will be to further refine this programme, operationalise arrangements, and develop scenario-specific plans with regional partners, including Māori communities. This continued investment will enhance New Zealand's resilience and ensure readiness for future catastrophic events.
Effective Emergency Management System
“The emergency management system is well coordinated and aligned to clear, shared priorities”.
Emergency Management system is effective - Performance excellence
In September 2024, the Government accepted the 14 recommendations of the Government response to the Report of the Government Inquiry into the Response to the North Island Severe Weather Events (the NISWE Inquiry) with the final report being published in October 2024. In April 2025 an Emergency Management System Improvement Programme Roadmap (the Roadmap) was agreed in-principle by Cabinet with the final Roadmap being released in June 2025. An anchor project for the Roadmap is a Common Operating Picture which will deliver the technology and systems needed to support shared situational awareness and decision-making in response and recovery.
NEMA contributed to a number of external inquiries including Phase 2 of the Royal Commission of Inquiry into COVID-19 Lessons Learned, coronial inquiries into the 2023 North Island severe weather events and 2019 Whakaari/White Island volcanic eruption, and the Waitangi Tribunal.
In 2024/25, we deepened our relationships and collaboration with CDEM Groups through the Emergency Management Leadership Group. Through its lead coordination role, NEMA brings together the 16 CDEM Groups to work in partnership towards achieving system-wide goals. This collective approach focuses on ensuring that the emergency management sector is considered and represented collectively, rather than 17 separate entities. NEMA works directly in the regions to support CDEM Group activities across reduction, readiness, response and recovery.
We revised NEMA's recovery engagement strategy to allow a case-management approach when liaising with regions. This allows NEMA to work more closely with each region, improving relationships, coordination, and information flow across all levels of government. In addition, we have worked with local government to progress three joint recovery workstreams, including on pre-disaster recovery planning, recovery capability development, and a Recovery Toolkit of resources.
We launched a new International Strategy that outlines a framework to support the strengthening of New Zealand's emergency management system while contributing to the global body of emergency management knowledge. It aligns closely with New Zealand's goal to create a safe, secure, and resilient Indo-Pacific region.
An enabled system
We continued to co-develop a fully scalable National Recovery Operating Model (NROM) working with local government, the National Recovery Coordination Group (NRCG) and the Cyclone Recovery Unit within DPMC, to lift recovery, and integrate recovery and response. As chair of the NRCG, NEMA mapped central government roles and responsibilities and stakeholder networks and created a Central Government Recovery Funding Factsheet for emergency management sector use.
In June 2025, we signed a MOU relating to Cooperation on Insurance for Emergency Management with the Natural Hazards Commission and the Insurance Council of New Zealand. This MOU recognises that insurance support is a critical part of a community's recovery following an emergency or natural hazard event. It is important that insurers, central and local government, and the emergency management sector work together to ensure a coordinated recovery effort for communities' recovery.
NEMA also progressed work on the new Emergency Management Bill which is intended to be passed during the current Parliamentary term. Legislative reform is needed to strengthen the emergency management system and address recommendations from the Government Response to the NISWE Inquiry. The new Emergency Management Bill, replacing the Civil Defence Emergency Management Act 2002, is an opportunity to make sure our legislative settings enable an emergency management system that can meet the growing risks we face.
A core part of the engagement process was consultation on a public discussion document that set out the policy issues and a range of legislative and non-legislative options to achieve the objectives of the new Bill. The consultation period ran from 15 April to 20 May 2025 with 324 substantive submissions received. The volume of submissions demonstrates the public interest in ensuring the legislation is fit-for-purpose.
A professionalised workforce
In early 2025, we commenced Exercise Tahu Nui a Rangi (Space Weather) which runs across five days, concluding in November 2025 testing NEMA's new National Space Weather Response Plan. This exercise informs updates to the plan and strengthens our preparedness for a space weather event. NEMA staff were taken through the Plan's phases and the space weather science and were given opportunity to examine their roles. Refer to page 20 in the DPMC Annual Report 2024/25 for information about its role in space weather preparedness.
Throughout the year, NEMA participated in, and supported exercises led by CDEM groups. In November 2024 NEMA took part in Exercise Pandora, led by the Canterbury CDEM Group. The exercise built on Exercise Rū Whenua and focused on the local-level response to an Alpine Fault earthquake in the days following the initial main shake. This was a valuable opportunity to practice our earthquake response processes and to support the South Island CDEM Groups participating in the exercise.
An Agile and Integrated NEMA
“NEMA is a high performing organisation, with the capabilities, culture and ways of working to succeed”.
A great and agile place
We developed Te Kāhui Mataara which outlines NEMA's approach to building cultural capability and setting the direction for NEMA to connect with iwi Māori within the emergency management system. This includes the cultural education needed to engage effectively with Māori, the strengthening of relationships, and recognising the importance of Māori values, perspectives, and knowledge within the emergency management system.
In March 2025, the latest iteration of our internal lessons management register was released. The updated register incorporates NEMA's After Action Reviews and provides enhanced oversight of NEMA's improvement actions arising from the North Island Severe Weather Events, and other events and exercises. It also streamlines access to lessons information, supports formal lessons management methodology, and strengthens our ability to track progress and accountability across the organisation.
A thriving and integrated NEMA
In April 2025, NEMA launched an internal Leadership Framework to clarify expectations across all levels of leadership. The framework provides consistency across the organisation with regards to expected behaviours, and guides NEMA staff in identifying their strengths and development needs as part of planning their career and development.
This year NEMA has created a Strategic Plan which provides a 10-year roadmap towards achieving the aspirations of the Strategic Framework. The Plan sets out long-term objectives enabling long and medium-term planning for how to achieve them. This guides annual planning and performance measurement to align with long term goals.
Our organisation#
Our people
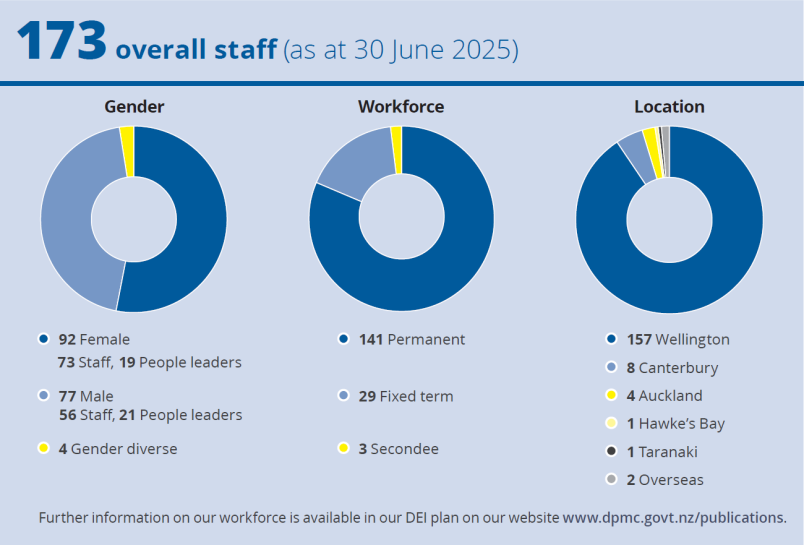
Engagement and Culture
Building our organisational health and capability
NEMA's 2025 Te Taunaki Public Service Census Employee Engagement Index score (overall satisfaction) was 0.80 compared with a public service average of 0.77. NEMA's strengths include contributing to, and delivering, better outcomes for New Zealand, and our collaboration, respect and inclusion. Areas for improvement include strengthening our leadership through change, managing performance, and enabling good decision-making. NEMA has committed to lifting the areas for improvement through its Te Taunaki Action Plan.
Our Diversity, Equity and Inclusion (DEI) Plan includes a set of actions to help close gender, Māori, Pacific and ethnic pay gaps at NEMA. This plan indicates our commitment to workplace diversity. Our DEI plan is available on the DPMC website at Publications.
NEMA staff members have individual development plans which record performance goals, development activities and how to demonstrate NEMA values and leadership capabilities. These have been aligned with the 2024/25 new internal Leadership Framework which guides individuals to consider their own strengths and development pathways needs as part of planning their career and leadership development at NEMA, as well as across the public sector.
Health, Safety and Wellbeing
Staff wellbeing continued to be a focus for NEMA in 2024/25. Additional psychological support continued to be provided to staff, who can choose from two separate providers with services available 24/7.
NEMA recently formed a Health and Wellbeing team to ensure we have processes and procedures in place to support staff working in the NCMC during a response. The team members are trained in managing psychosocial risks and providing mental health first aid to staff as required.
While NEMA shares a health and safety policy with DPMC, we face additional risks due to the emergency related nature of our work. NEMA is committed to the safety and wellbeing of our staff and visitors. In 2024/25 our health and safety programme has focused on:
- developing a health and safety strategy to improve the maturity of our health and safety processes and culture
- delivering training to grow NEMA leaders' knowledge of health and safety due diligence and responsibilities, and
- developing fatigue management protocols and tools to effectively manage and mitigate the risks associated with fatigue for NEMA staff in both business as usual and emergency response capacities.
The NEMA Health and Safety Committee, which comprises staff representatives, has fostered positive communication and consultation on health and safety matters between NEMA's leadership and staff.
For more information on progress related to shared DPMC and NEMA organisational health and capability objectives, refer to page 24 of the DPMC Annual Report.
Gender Balanced Leadership
Women occupied 46 percent of all leader roles (19 of 41) and 53 percent of T2 and T3. A slight decrease but similar to last year.
Gender pay gap
As a small agency, we can experience some GPG volatility. Beyond remuneration and recruitment, our focus has been on actions for retention and development of our current staff.
2024/25 mean: 7.7 percent
(Target: GPG remains stable)
(2023/24: 3.6 percent)
Our gender pay gap increased by 4.1 percentage points at year end 2024/25
2024/25 median: 3.2 percent (2023/24: 2.1 percent)
Our median gender pay gap has decreased significantly by 20.5 percentage points in the past year, from 23.7 percent to 3.2 percent
Our Operations #
Ā mātou whakahaere mahi
Our key work programmes, services and activities are set out on pages 35 to 38. Additionally, we report against our performance on appropriations on pages 60 to 62. Together these provide detailed information on what we set out to do, and how well we achieved our objectives.
Implementing the Government's Priorities
Government Targets
NEMA is not a lead agency for a Government target. Information on the targets can be found at Government Targets.
Other priorities
The Minister for Emergency Management and Recovery expects NEMA to deliver the Government response to the Report of the Government Inquiry into the Response to the North Island Severe Weather Events to strengthen the emergency management system. Information on our work is set out in pages 33 to 39.
Budget decisions
Through Budget 2024 and Budget 2025, ongoing funding was received for cost pressures in emergency management activities including tsunami monitoring and detection. Significant Budget initiatives are published in the Minister of Finance's Summary of Initiatives, available on the Treasury website. Information on other significant funding decisions taken during the year is available in the Supplementary and Estimates of Appropriations for Vote Prime Minister and Cabinet. The table below provides information on these significant Budget initiatives and related performance information:
| Initiatives | Budget year | Intended results | Performance information |
|---|---|---|---|
| Emergency management readiness, response and recovery | 2024 | Fit-out and technology upgrade for new National Emergency Management Facility | Reporting Against our Appropriations on pages 60 to 62 |
Baseline savings
NEMA was not required to achieve baseline savings in 2024/25.
Reduction in expenditure on contractors and consultants
NEMA expenditure increased slightly by $76,000 in 2024/25 due to continuation of significant projects. This compares with expenditure in past years as shown below:
| 2022/23 $000 |
% workforce expenditure |
2023/24 $000 |
% workforce expenditure |
2024/25 $000 |
% workforce expenditure |
|---|---|---|---|---|---|
| 1,674 | 7 | 1,430 | 6 | 1,506 | 6 |
Treaty Settlement Commitments
He korowai whakamana
In December 2022, Cabinet agreed to the He Korowai Whakamana framework for achieving oversight of Treaty settlement commitments and a consistent approach for addressing and resolving settlement issues. Part of the framework requires core Crown agencies to track the status of their commitments using Te Haetea, and report on these annually.
In December 2022, Cabinet agreed to the He Korowai Whakamana framework for achieving oversight of Treaty settlement commitments and a consistent approach for addressing and resolving settlement issues. Part of the framework requires core Crown agencies to track the status of their commitments using Te Haetea, and report on these annually.
The status of NEMA Treaty Settlement Commitments
As of 30 June 2025, NEMA was listed as a responsible entity for two Treaty Settlement commitments, both from the Ngāti Rangi Claims Settlement Act 2019 (section 109 and 110) (30 June 2024:2).
- Section 109 provides that decision-makers under the Civil Defence Emergency Management Act 2002 must have regard to Te Mana Tupua and Ngā Toka Tupua. This commitment is recorded as ‘on track.'
- Section 110 provides that Persons exercising or performing statutory functions, powers, or duties that relate to the Whangaehu River, or to activities in the Te Waiū-o-Te-Ika catchment that affect the Whangaehu River, may consider Te Mana Tupua and Ngā Toka Tupua as a relevant consideration. This commitment is recorded as ‘yet to be triggered.' This is because none of NEMA's functions, powers or duties (under the Civil Defence Emergency Management Act 2002) have needed to be exercised that relate directly to the Whangaehu River (or to activities in the Te Waiū-o-Te-Ika catchment that affect the Whangaehu River).
The status of our Treaty settlement commitments

Source: Te Haeata Settlement Portal.
Carbon Neutral Government Programme
NEMA is committed to the Carbon Neutral Government Programme (CNGP) to measure, verify and report our greenhouse gas emissions. We are proud to have achieved Toitū Carbon Reduce certification in June 2025 in line with ISO 14064-1:2018 standard.
Total annual emissions and their source
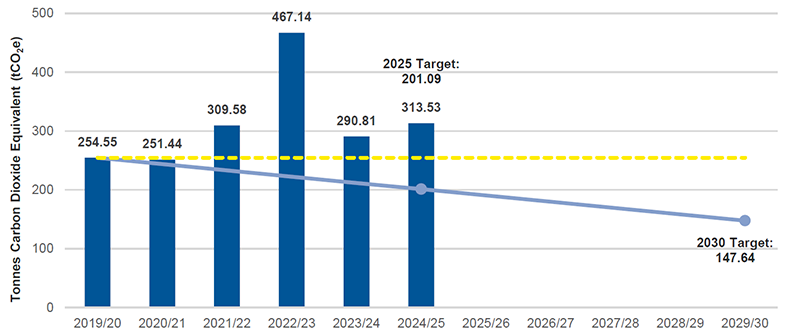
In our base year, we emitted 254.55 tonnes of carbon dioxide equivalent (tCO2e). In the following years our operations were impacted by COVID-19 with 251.55 tCO2e emitted in 2020/21 and 467.14 tCO2e emitted in 2022/23 when we activated the National Coordination Centre in response to the North Island severe weather events. This year our emissions were higher than previous years due to increased international travel.
Emissions profile broken down by category, scope and total annual emissions[9]
| Category | Scope | 2019/20 (tCO2e) |
2023/24 (tCO2e) |
2024/25 (tCO2e) |
|
|---|---|---|---|---|---|
| 1 | Direct emissions
|
Scope 1 | 36.66 | 74.18 | 25.73 |
| 2 | Indirect emissions from imported energy9
|
Scope 2 | 7.34 | 10.62 | 23.58 |
| 3 | Indirect emissions from transportation
|
Scope 3 | 205.02 | 189.47 | 246.81 |
| 4 | Indirect emissions from products and services used by organisation
|
Scope 3 | 4.38 | 16.55 | 17.42 |
| 5 | Indirect emissions associated with the use of products and services from the organisation | Scope 3 | 0 | 0 | 0 |
| 6 | Indirect emissions from other sources | Scope 3 | 0 | 0 | 0 |
| TOTAL GROSS EMISSIONS (tCO2e) | 254.55 | 290.81 | 313.53 | ||
| Change in gross emissions from previous financial year | -37.74% | 7.81% | |||
| Change in gross emissions since base year | 14.25% | 23.17% | |||
The table on page 42 shows our greenhouse gas emissions profile broken down by the four CNGP categories applicable to NEMA. In 2024/25, the emissions from transportation (Category 3) are the largest contributor to greenhouse gas emissions, with air travel being the primary emissions source.
Significant changes between 2023/24 and 2024/25 for direct emissions (Category 1) and imported energy (Category 2) is due to the change of the Wellington tenancy to 23 Kate Sheppard Place (23KSP). The previous tenancy of TSB Bank building used gas, while 23KSP does not. This has resulted to the decrease in natural gas and increase in electricity use. In addition to this, we have also started reporting on the electricity use of our international postings in Samoa and Tonga.
Total transportation emissions (tCO2e) 2024/25 compared to base year and prior year[10]
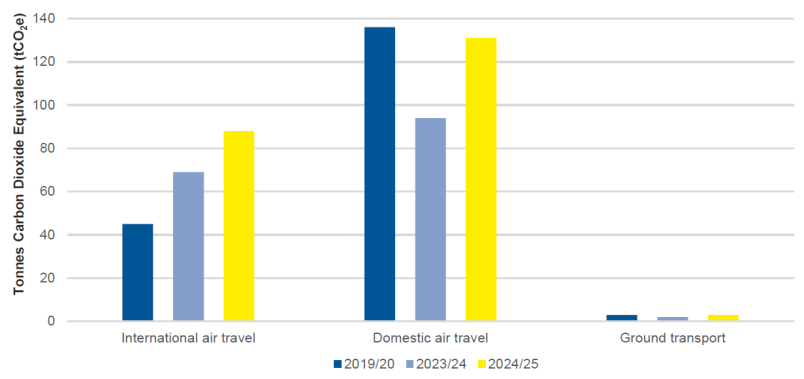
Emissions intensity by full-time equivalent (FTE) and expenditure
Since the base year, our work programme and number of staff have increased. Despite this growth, our emissions intensity for the last two years has been around the same level while continuing to deliver impactful work. While FTE staff members increased by 2.7 times since base year, our emissions intensity per FTE has decreased from 4.03 tCO2e to 1.83 tCO2e as shown below.
FTE and Expenditure for 2024/25 compared to base year and prior year
| KPI | 2019/20 | 2023/24 | 2024/25 |
|---|---|---|---|
| FTEs | 63.10 | 158.7 | 173.2 |
| Expenditure ($m)[11] | 49.18 | 50.686 | |
| Emissions intensity | |||
| Total gross emissions per FTE (tCO2e) | 4.03 | 1.83 | 1.81 |
| Total gross emissions per million dollars of expenditure (tCO2e) | 5.91 | 6.19 |
Progress towards 2025 and 2030 targets
Our Emissions Reduction Plan, launched in 2022 sets out a pathway for reducing emissions in line with the Government's commitment to keep global warming to less than 1.5 degrees of warming. These actions focus on building climate positive behaviours in our work. We have committed to the following targets:
- 2025 target: Gross emission (all Categories) to be no more than 201.09 tCO2 emissions - a 21 percent reduction in gross emission compared to base year.
- 2030 target: Gross emission (all Categories) to be no more than 147.64 tCO2 emissions - a 42 percent reduction in gross emission compared to base year.
The 2025 target to reduce emissions by 21% from base year would have enabled NEMA to become carbon neutral. This was an ambitious target given NEMA's operations. We are focusing on reducing the controllable portion of emissions whilst in a context of increasing expectations from the government and communities. The nature of NEMA's role in emergency management means staff are required to travel, often at short notice, during an emergency response or recovery phase. Emergencies across New Zealand frequently require air and vehicle travel and overnight stays in remote locations.
Our reduction plan and future reporting
Our Emissions Reduction Plan will enable us to reduce emissions where possible through understanding and reviewing our operation and business travel behaviours. This Plan uses several behavioural and investment levers to achieve our emissions reduction commitments and CNGP offsetting requirements.
Highlights
Efforts in reducing emissions include:
- Changing the Wellington tenancy to a building that does not use natural gas for heating.
- Working with suppliers to book EVs as a default preference when renting cars as per our travel policy. Note that there may be circumstances where an EV is not appropriate for our needs.
- Working with travel arrangers to promote alternative options to taxis, such as the airport bus.
- Procuring hybrid vehicles as first preference for NEMA fleet vehicles, where operationally appropriate.
- Improving audio visual technology to reduce need for travel.
Notes
- [8] The 60/40 claims process is a Government policy to reimburse 60% (above the local authority threshold) of eligible costs incurred by local authorities in relation to emergencies by NEMA.
- [9] In May 2023, the Ministry for the Environment issued an update in the electricity transmission and distribution emissions factors. This was necessary to ensure that the CNGP remain aligned with leading science and is up to date with the latest information available. As required by the CNGP we updated previous years to reflect this change.
- [10] Ground transport includes transport fuel from 2023/24. Prior years have been restated.
- [11] Expenditure data is only available from 2021/22.
Our performance reporting#
Tā mātou pūrongo mahi
This section reports on what we achieved within each appropriation against the expectations set in the Vote Prime Minister and Cabinet Estimates and Supplementary Estimates of Appropriations for 2024/25.
Service performance judgements and assumptions#
The service performance information on pages 4 to 21, pages 46 to 50 and pages 55 to 62 was prepared in accordance with Public Benefit Entity Financial Reporting Standard 48 (PBE FRS 48). Performance measures deleted or expired through the Supplementary Estimates of Appropriations 2024/25 from the Estimates of Appropriations 2024/25 are explained on pages 55, 58 and 59.
Disclosure of judgements
In preparing the service performance information for the 2024/25 year the Department has made a number of significant judgements about what information to present. These judgements are based on an assessment of the most appropriate and meaningful information for readers assessing performance against the Department's objectives and to fairly represent the diverse nature of the Department's activities. Decisions about the service performance information to present were made by Executive Leadership Team Board members in consultation with the relevant appropriation Ministers either when an appropriation was created, or as a response to having identified alternative measures that enhance the quality of performance information that can be presented and to meet PBE FRS 48 standards.
The judgements that had the most significant effect on the non-financial information presented related to the selection of information about the Department's Strategic Intentions and related activities during the period. For some activities there is not a distinct numerical value that can be observed to reflect the effectiveness of that activity. Judgement is applied to identify how measures can be derived to provide readers of the Annual Report with relevant information.
Significant judgements are required in relation to the Department's policy and assessments quality, satisfaction measures and services to Ministers and Cabinet. How we make these judgements is described below.
Explanatory commentary for non-achievement
In our reporting non-achievement of a target, we provide an explanation where it assists in telling a better performance story. We do so in instances where non-achievement is 8 percent or more as such variation is generally accompanied by written commentary that provides insights into the results. Where the target performance is 4 out of 5, this equates to a variance in scoring of 0.32 or more below the target. This means that a score of 3.68 or below will have an accompanying explanation as to why the target was not met. A score below 4 and above 3.68 is reported as not achieved without additional commentary.
Quality of Policy Advice and Intelligence Assessments
A key role of DPMC is the provision of policy advice and intelligence assessments to inform decision-making. It is important that our policy advice and intelligence assessments are of high-quality, timely, and relevant. We use the Policy Quality Framework (PQF) to assess the quality of a randomly selected sample of policy advice and intelligence assessments. Policy advice and intelligence assessments are scored on a scale of 1 to 5, where 1 means unacceptable and 5 means outstanding. All first opinion policy functions contribute to one policy quality score across DPMC. NEMA reports a separate policy quality score. The quality of intelligence assessments is determined through an external review of a sample of 15-16 intelligence assessments produced during the financial year.
The policy quality review panel consists of senior policy staff across DPMC and NEMA. Prior to 2023/24, the review panel was chaired by an external contractor. Since 2023/24 a senior staff member from the Policy Advisory Group, whose work is not included in the policy quality review, chaired the panel. A sample of 14 papers for DPMC and six papers for NEMA were reviewed in line with guidance from the Policy Project on sample sizes for small agencies. All other aspects of the process meet the PQF and remained the same, other than that the selection of the random sample was conducted using a technology tool by the team administering the panel.
The review of intelligence assessments is conducted at the end of the financial year by four external reviewers who are selected based on their appropriate security clearance level and experience with intelligence assessments.
We have set targets related to the average quality of our advice and intelligence assessments, and additionally for policy advice, the distribution of policy quality scores so that we can provide an additional focus for our policy quality improvement efforts.
Average scores
The PQF sets a public service-wide target for policy quality of 3 out of 5 for an assessed sample of papers. The Department sets a higher target of 4 out of 5.
We have used the following judgements when reporting these results:
- not achieved - where the policy or intelligence assessment quality score is less than the target score, and
- achieved - where the policy or intelligence assessment quality score meets or exceeds the target score.
Distribution measures
The PQF recommends setting a target for the distribution of policy quality scores across an assessed sample. DPMC has set the following targets to provide a better reflection of performance:
- 70% of papers score 3 or higher
- 30% of papers score 4 or higher, and
- no more than 10% of papers score 2 or less.
We have used the following judgements when reporting these results:
- not achieved - where fewer than two out of the three dimensions of the policy quality distribution score have been met
- partially achieved - where two out of the three dimensions of the policy quality distribution score have been met, and
- achieved - where all of the three dimensions of the policy quality distribution score have been met.
Satisfaction measures
Measuring Ministerial, Governor-General or stakeholder satisfaction with advice and services is conducted annually for the entire financial year by survey. Two types of satisfaction measures are reported on: Satisfaction with policy advice and satisfaction with advice and services. Satisfaction is measured on a scale from 1 to 5, where 1 means never met expectations and 5 means always exceeded expectations.
Satisfaction with policy advice
Ministerial satisfaction with policy advice is either an overall satisfaction rating communicated to officials or measured using the Policy Project's Ministerial Policy Satisfaction Survey. The survey contains a common set of questions that agencies use to assess their Minister's satisfaction with the services provided. The PQF sets out a public service-wide methodology for assessing Ministerial and stakeholder satisfaction. The PQF does not set a public-service wide standard for this measure. All DPMC policy satisfaction measures have a target of 4 out of 5, reflecting the high level of ambition for supporting our Ministers with timely, well informed advice.
Satisfaction with advice and services
Satisfaction in relation to advice and/or services is either an overall satisfaction rating communicated to officials or an average of overall satisfaction in the specified area. Satisfaction is measured on a scale from 1 to 5, where 1 means never met expectations and 5 means always exceeded expectations.
Satisfaction with the leadership of the National Resilience System (previously the National Security System)
Satisfaction with the leadership of the National Resilience System provided by DPMC is assessed annually for all risk-coordinating agencies that make up the National Resilience System. This comprises the various systems (national security, hazards, strategic crisis, and emergency management systems) that function collectively to improve resilience to our most serious hazards and national security threats with a coordinating agency responding to each risk area. DPMC leads the National Resilience System with the National Hazards Board and the National Security Board providing governance and oversight.
Chief Executives (or equivalent) of the agencies that make up the National Security Board and National Hazards Board who provide leadership to the National Resilience System communicate their satisfaction with DPMC's leadership of the National Resilience System through an annual survey of risk-coordinating agencies. Satisfaction is measured on a scale from 1 to 5, where 1 means never met expectations and 5 means always met expectations. The number of agencies responding to the survey may differ from year to year and DPMC uses best-endeavours to obtain survey responses. Regardless of the number of responses received, these are averaged to calculate performance.
Public confidence in government agencies to deal with national security threats and emergencies
DPMC commissions a biennial National Risks Public Survey to understand public perceptions of National Risks to inform government work to build resilience and support the safety, security and prosperity of New Zealanders.
The Survey provides an understanding, across a nationally representative total sample of 2,350 people with a focus on:
- New Zealanders' awareness of National Risks, including perceived likelihood of these over the short (next 12 months) and long term (next 10 years).
- Public confidence in government agencies' abilities to protect and respond to National Risks.
- Opportunities to build confidence, share information, and better engage the public.
While previous surveys focused on national security threats, the scope of the 2024 survey was broadened to include significant hazards. Selected results from Question 11 in the survey inform the trend of an indicator in Outcome Three. The results selected relate to areas our work contributes to. The survey results are published online: https://www.dpmc.govt.nz/our-programmes/risk-and-resilience/national-risk-framework/2024-national-risks-public-survey-report.
The reported data is the proportion of respondents who responded “Very confident” or “Somewhat confident” to 32 national security threats or significant hazards using the following question which is presented on the screen one at a time in a randomised order.
If any of the following were to happen in the next twelve months, how confident are you that New Zealand's government agencies could provide appropriate levels of security and protection and respond effectively to:
The Outcome Three indicator is calculated as an average of the selected subset of threat or hazard areas [nine out of 32], that related to the 2023/24 work programmes of the National Security Group and NEMA.
| Threat or hazard | Link to 2023/24 work programme |
|---|---|
| Disinformation | Countering Disinformation work programme |
| Breakdown in national infrastructure due to an attack | Critical Infrastructure work programme |
| Terrorist attack/violent extremism | Countering terrorism and violent extremism team |
| Other countries threatening New Zealand interests in the Pacific | Pacific National Security and Intelligence Coordination |
| Other countries interfering in New Zealand affairs | Countering Foreign Interference |
| Foreign country/actor coercing New Zealand to act against its interests | |
| Hacking into information systems | National Cyber Policy Office |
| Emerging technology (e.g. deep fakes, autonomous weapons) | |
| Natural disaster | NEMA |
The biennial National Risks Public Survey was last conducted in the 2023/24 financial year. The reported result for 2024/25 uses the same data. Further information on this outcome indicator can be found on page 50.
Our Ministers
- In 2024/25, the following Ministers were sent Ministerial satisfaction surveys to complete at year end:
- Prime Minister Rt Hon Christopher Luxon - Prime Minister and Minister for National Security and Intelligence, and
- Hon Mark Mitchell - Minister for Emergency Management and Recovery.
Where there has been a change in Minister or other stakeholders during the financial year, the Department encourages them to seek the view of their predecessor in completing the survey.
Timeliness of ministerial Official Information Act 1982 (OIA) requests
DPMC support the Prime Minister, Minister for National Security and Intelligence and Minister for Emergency Management and Recovery through the provision of high quality and timely Ministerial services. A core part of this service is drafting responses to Official Information Act 1982 (OIA) requests within agreed timelines, when commissioned by the Minister's Office.
DPMC aims to provide 95% of responses to ministerial OIA requests to the relevant Minister's office within 18 working days of being commissioned, unless an extension is agreed. The selection of this timeliness measure and target provides an accurate indicator of DPMC's performance in providing high quality and timely services to the Ministers we service to allow them to respond to OIA requests within the statutory timeline. All Ministers are subject to the OIA and must provide official information within 20 working days of receiving a request, unless extended.
All ministerial OIA requests for Ministers serviced by DPMC are processed through an internal workflow management tool with timeliness expressed as a percentage. Responses to ministerial OIA requests commissioned to DPMC and completed within the 1 July 2024 - 30 June 2025 reporting period are included in this measure.
OIA requests received by DPMC are not included in this measure. Departmental OIA timeliness is reported to the Public Service Commission and can be found on their website: https://www.publicservice.govt.nz/guidance/official-information/oia-statistics.
Other appropriation measures
The selection of other activity measures and their methodology is explained under each appropriation performance report. Results are reported to two decimal places. Where whole numbers are to be reported, these have been rounded, where necessary, to the nearest whole number.
Outcomes measures
The significant judgements and methodology relating to specific outcome measures are shown below.
| Indicator and trend | Methodology | Judgement |
|---|---|---|
| Outcome 1: The Government is enabled to deliver its priorities | ||
| Quality of Policy Advice and Assessments increases over baseline year (2022/23: 3.6) | Three policy quality and assessment measures are averaged to determine the trend. These are the DPMC and NEMA average scores for assessed policy papers and average score of a sample of intelligence assessments reviewed by an external reviewer (the latter survey was not included in the baseline year). |
Not on track - where the average of the policy or assessment quality scores is less than the baseline score On track - where the average of the policy or assessment quality scores exceeds the baseline score No change - where the average of the policy or assessment quality scores has not changed from the baseline score Explanation: 8% or 0.29 from baseline |
| Prime Minister and Ministerial satisfaction with advice and servicing is maintained or increases over baseline year (2022/23: 4.8) | All portfolio satisfaction measures for the Prime Minister and Ministers are averaged to determine the trend. These will fluctuate each year depending on the number of portfolios and the number of measures within each. |
Not on track - where the average of the satisfaction scores is less than the baseline score On track - where the average of the satisfaction scores meets or exceeds the baseline score Explanation: 8% or 0.33 from baseline |
|
Uptake of Policy Project tools and frameworks is maintained or increases over baseline year (2023/24:
|
This indicator is calculated using the activities of the Policy Project to build policy quality capability in the public service. This consists of the prior years' uptake of tools and frameworks. The indicator baseline, consisting of three data points, is set from the 2023/24 year due to a lag in data availability. |
Not achieved - where fewer than two out of the three dimensions of the indicator have been met Partially achieved - where two out of the three dimensions of the indicator have been met Achieved - where all of the three dimensions of the indicator have been met. Explanation: 8% from baseline |
| Outcome 2: New Zealand's systems and institutions of executive government are trusted, effective and enhance our nation's interests | ||
| Ministerial satisfaction with the systems and institutions of executive government is maintained or increases over baseline year (2022/23: 5.0) |
The Prime Minister, on behalf of all Ministers satisfaction survey response. This indicator is calculated as an average of questions asked to the Prime Minister, in their role as Chair of Cabinet, regarding satisfaction with DPMC's performance in ensuring systems and institutions of executive government are trusted and effective. |
Not on track - where the satisfaction score is less than the baseline score On track - where the satisfaction score meets or exceeds the baseline score Explanation: 8% or 0.4 from baseline |
| Governor-General satisfaction with support provided is maintained or increases over baseline year (2022/23: 4.5) | Two Governor-General satisfaction measures were averaged to determine the trend. These are satisfaction with advisory and constitutional services, and satisfaction with the programme and household services. This also provides an overall measure for the appropriation. |
Not on track - where the average of the satisfaction scores is less than the baseline score On track - where the average of the satisfaction scores meets or exceeds the baseline score Explanation: 8% or 0.36 from baseline |
| Outcome 3: People living in New Zealand are, and feel, resilient, safe and secure | ||
| Public confidence in government agencies to deal with national security threats and emergencies (2022/23: 53%) |
An average of the following subset of questions/threat areas from the biennial National Risks Public Survey, that relate to the National Security Group and NEMA 2023/24 work programmes determine the trend:
|
Not on track - where the average confidence score for relevant questions is less than the baseline score On track - where the average confidence score for relevant questions meets or exceeds the baseline score Explanation: 8% or 4 percentage points from baseline |
| Ministerial satisfaction with leadership of the National Security and Emergency Management Systems is maintained or increases over baseline year (2022/23: 4.50) | Two Ministerial satisfaction survey responses on the leadership of the national resilience, national security and emergency management systems, from the Minister for National Security and Intelligence and Minister for Emergency Management and Recovery were averaged to determine the trend. |
Not on track - where the average of the satisfaction scores is less than the baseline score On track - where the average of the satisfaction scores meets or exceeds the baseline score Explanation: 8% or 0.36 from baseline |
| National security agencies are satisfied with the leadership of the national security system (2022/23: 3.3) | Responses to a survey on satisfaction with the leadership of the National Resilience System sent to Chief Executives of the agencies that make up the National Security Board and National Hazards Board were averaged to determine the trend. |
Not on track - where the average of the satisfaction scores is less than the baseline score On track - where the average of the satisfaction scores meets or exceeds the baseline score Explanation: 8% or 0.26 from baseline |
|
New Zealanders who have:
|
NEMA's key priority is to ensure that people living in New Zealand are well-informed and able to respond to emergencies. Action taken is reported as a separate result. Knowledge of action to take is reported as the average of two NEMA community awareness and readiness surveys to determine the trend. All three results are averaged to provide an overall measure for the appropriation. |
Not on track - where the average of the survey scores is less than the baseline score On track - where the average of the survey scores exceeds the baseline score No change - where the average of the survey scores has not changed from the baseline score Explanation: 8% or 5.49 from baseline |
Appropriation statements#
Statement of Budgeted and Actual Departmental and Non-departmental Expenses and Capital Expenditure against Appropriations
for the year ended 30 June 2025
| 2024/25 Actual $000 |
2024/25 Budget $000 |
2024/25 Supp. Estimates $000 |
Where performance information is reported |
|
|---|---|---|---|---|
| DEPARTMENTAL OUTPUT EXPENSES | ||||
| Extreme Weather Events All of Government Response | 7,382 | 13,948 | 9,198 | Our performance reporting section |
| TOTAL DEPARTMENTAL OUTPUT EXPENSES | 7,382 | 13,948 | 9,198 | |
| DEPARTMENTAL CAPITAL EXPENDITURE | ||||
| Department of the Prime Minister and Cabinet - Capital Expenditure PLA | 350 | 193 | 400 | Our performance reporting section |
| TOTAL DEPARTMENTAL CAPITAL EXPENDITURE | 350 | 193 | 400 | |
| NON-DEPARTMENTAL OUTPUT EXPENSES | ||||
| Centre of Excellence for Preventing and Countering Violent Extremism | - | 500 | - | Exempt under section 15D(2)(b)(iii) of the Public Finance Act 1989 |
| Preventing and Countering Violent Extremism | 500 | - | 500 | Exempt under section 15D(2)(b)(iii) of the Public Finance Act 1989 |
| North Island Severe Weather Events – Administrative Services (MYA Expense) | 2,540 | 2,900 | 3,340 | Exempt under section 15D(2)(b)(iii) of the Public Finance Act 1989 |
| TOTAL NON-DEPARTMENTAL OUTPUT EXPENSES | 3,040 | 3,400 | 3,840 | |
| NON-DEPARTMENTAL OTHER EXPENSES | ||||
| Extreme Weather Events – Regional and Local Support | 24,930 | 25,000 | 25,000 | Minister's Report appended to the DPMC Annual Report |
| Flood Resilience Projects (MYA Expense) | 40,019 | 27,386 | 40,019 | Minister's Report appended to the DPMC Annual Report |
| Governor-General's Programme PLA | 1,933 | 1,650 | 2,050 | Exempt under section 15D(2)(b)(iii) of the Public Finance Act 1989 |
| Governor-General's Salary and Allowance PLA | 485 | 500 | 500 | Exempt under section 15D(2)(b)(ii) of the Public Finance Act 1989 |
| Governor-General's Travel Outside New Zealand PLA | 154 | 407 | 407 | Exempt under section 15D(2)(b)(iii) of the Public Finance Act 1989 |
| Local Authority Emergency Expenses PLA | 516 | 5,000 | 5,000 | Minister's Report appended to the DPMC Annual Report |
| North Island Severe Weather Events (MYA Expense) | 917,575 | 694,868 | 1,002,829 | Minister's Report appended to the DPMC Annual Report |
| Remuneration of Commissioners of Intelligence Warrants PLA | 16 | 174 | 174 | Exempt under section 15D(2)(b)(ii) of the Public Finance Act 1989 |
| TOTAL NON-DEPARTMENTAL OTHER EXPENSES | 985,628 | 754,985 | 1,075,979 | |
| MULTI-CATEGORY EXPENSES AND CAPITAL EXPENDITURE | ||||
| Advice and Support Services MCA | ||||
| DEPARTMENTAL OUTPUT EXPENSES | ||||
| Advice and Support to Government and the Governor General |
47,695 | 48,954 | 52,589 | Our performance reporting section |
| NON-DEPARTMENTAL OTHER EXPENSES | ||||
| Depreciation and Maintenance of Government House Buildings and Related Assets | 2,080 | 2,232 | 2,307 | Exempt under section 15D(2)(b)(ii) of the Public Finance Act 1989 |
| Support for Prime Minister's Chief Science Advisor | - | 295 | - | Exempt under section 15D(2)(b)(iii) of the Public Finance Act 1989 |
| NON-DEPARTMENTAL CAPITAL EXPENDITURE | ||||
| Government House - Capital Expenditure | 346 | 550 | 750 | Exempt under section 15D(2)(b)(iii) of the Public Finance Act 1989 |
| TOTAL ADVICE AND SUPPORT SERVICES MCA | 50,121 | 52,031 | 55,646 | |
| Emergency Management Leadership and Support MCA | ||||
| DEPARTMENTAL OUTPUT EXPENSES | ||||
| Advice and Support for Emergency Risk Reduction, Readiness, Response and Recovery | 51,502 | 49,982 | 56,595 | Our performance reporting section |
| NON-DEPARTMENTAL OTHER EXPENSES | ||||
| Emergency Risk Reduction, Readiness, Response and Recovery | 19,408 | 12,526 | 20,576 | Exempt under section 15D(2)(b)(ii) of the Public Finance Act 1989 |
| TOTAL EMERGENCY MANAGEMENT LEADERSHIP AND SUPPORT MCA | 70,910 | 62,508 | 77,171 | |
| TOTAL MULTI-CATEGORY EXPENSES AND CAPITAL EXPENDITURE | 121,031 | 114,539 | 132,817 | |
| TOTAL ANNUAL AND PERMANENT APPROPRIATIONS | 1,117,431 | 887,065 | 1,222,234 | |
Reconciliation between total appropriations for Departmental expenses and the Departmental Statement of Comprehensive Revenue and Expenses
| 2023/24 Actual $000 |
2024/25 Actual $000 |
|
|---|---|---|
| 108,045 | Total expenses in Departmental Statement of Comprehensive Revenue and Expenses | 106,579 |
| 108,045 | TOTAL APPROPRIATIONS FOR DEPARTMENTAL EXPENSES | 106,579 |
Reconciliation between total appropriations for Non-departmental expenses and the Schedule of Non‑departmental Expenses
| 2023/24 Actual $000 |
2024/25 Actual $000 |
|
|---|---|---|
| 898,334 | Total expenses in Schedule of Non-departmental Expenses | 1,130,531 |
| (49,163) | GST input expense | (124,540) |
| 849,171 | TOTAL APPROPRIATIONS FOR NON-DEPARTMENTAL EXPENSES | 1,005,991 |
Reconciliation to Total Annual and Permanent Appropriations
| 2023/24 Actual $000 |
2024/25 Actual $000 |
|
|---|---|---|
| 108,045 | Total Appropriations for Departmental Expenses | 106,579 |
| 849,171 | Total Appropriations for Non-departmental Expenses | 1,005,991 |
| - | Remeasurement of provisions for emergency events | 4,165 |
| 5,139 | Total Departmental Capital Expenditure | 350 |
| 857 | Total Non-departmental Capital Expenditure | 346 |
| 963,212 | TOTAL ANNUAL AND PERMANENT APPROPRIATIONS | 1,117,431 |
Statement of Departmental and Non-departmental Expenses and Capital Expenditure incurred without, or in excess of Appropriation, or other Authority
for the year ended 30 June 2025
The Department has not incurred any departmental or non-departmental expenses or capital expenditure without, or in excess of appropriation, or other authority (2024: Nil).
Statement of Capital Injections
for the year ended 30 June 2025
| 2023/24 Actual $000 |
2024/25 Actual $000 |
2024/25 Budget $000 |
2024/25 Supp. Estimates $000 |
|
|---|---|---|---|---|
| 2,860 | Capital Injection | - | 93 | 2,270 |
Statement of Capital Injections without, or in excess of, Authority
for the year ended 30 June 2025
DPMC has not received any capital injections during the year without, or in excess of, authority (2024: Nil).
Reporting against our appropriations#
Extreme Weather Events All of Government Response
This appropriation is intended to achieve effective leadership and coordination of the government's response to the sequence of 2023 extreme weather events that impacted the North Island.
What we achieved
| Performance measure | Target 2024/25 |
Result 2023/24 |
Result 2024/25 |
Achieved |
|---|---|---|---|---|
| The Minister for Emergency Management and Recovery is satisfied with the leadership and coordination of the extreme weather events recovery | 4 | 4.75 | 4 | ✔ |
| The Minister for Emergency Management and Recovery is satisfied with the policy advice service provided by the Cyclone Recovery Unit | 4 | 4.86 | 4.25 | ✔ |
| Average score for assessed policy papers | 4 | 3.17 | 3.61 | ✗ |
| Quality of policy advice papers - 70% score 3 or higher, 30% score 4 or higher and no more than 10% score 2 or less | Achieved | Partially achieved | Achieved | ✔ |
Why these measures were chosen
These performance measures were selected as they provide meaningful information on DPMC's core deliverable of hosting the functional Chief Executive, Cyclone Recovery in leading, coordinating and monitoring the severe weather recovery across government.
Why we did not achieve our policy quality target
We set two measures of policy quality, one an average score and one on the distribution of scores. This year, we achieved the distribution measure and did not achieve the average score measure.
A random sample of our policy papers was assessed with an in-house review panel. We met all three components of the distribution measure: 100% of our papers scored 3 or higher and no papers scored 2 or below and 35.71% of our papers scored 4 or above. We made a significant improvement on last year's result, however are still below our target. Overall, our results show that our work to improve our policy advice still has room to improve. We will continue to focus on implementing the recommendations of the review to help us further improve our advice and work towards achieving our ambitious targets.
Changes in performance measurement
The following measure was removed in the Estimates of Appropriations 2024/25 as the Cyclone Recovery Chief Executive Governance Group ended on 29 January 2024:
- The Cyclone Recovery Chief Executive Governance Group is satisfied with the coordination of the extreme weather events recovery.
The following measure was revised in the Estimates of Appropriations 2024/25 as the Cyclone Recovery Taskforce ended on 19 February 2024:
- The Minister for Emergency Management and Recovery is satisfied with the policy advice service provided by the Cyclone Recovery Unit and Taskforce.
How much it cost
| 2023/24 Actual $000 |
2024/25 Actual $000 |
2024/25 Budget $000 |
2024/25 Supp. Estimates $000 |
|
|---|---|---|---|---|
| 14,755 | Revenue Crown | 9,196 | 13,948 | 9,198 |
| 14,755 | TOTAL REVENUE | 9,196 | 13,948 | 9,198 |
| 7,685 | Expenses | 7,382 | 13,948 | 9,198 |
| 7,070 | Net Surplus/(Deficit) | 1,814 | - | - |
Departmental expenditure for this appropriation was lower than both the Budget and the Supplementary Estimates of Appropriations due to uncommitted contingency funding that was not required before the Chief Executive, Cyclone Recovery was disestablished on 30 June 2025. Responsibility for several residual activities relating to the 2023 extreme weather events have transferred to DIA with effect from 1 July 2025, with other functions transferred to DPMC.
Department of the Prime Minister and Cabinet - Capital Expenditure PLA
This appropriation is intended to achieve the renewal, upgrade or redesign of assets in support of the delivery of the Department's services.
What we achieved
In 2024/25, expenditure was in accordance with the Department's approved capital asset management plan for the renewal, upgrade or redesign of IT equipment ($0.197 million), furniture ($0.077m), fixtures and fittings ($0.070 million), and plant and office equipment ($0.006 million). This enabled us to maintain an effective operating environment for the Department.
How much it cost
| 2023/24 Actual $000 |
2024/25 Actual $000 |
2024/25 Budget $000 |
2024/25 Supp. Estimates $000 |
|
|---|---|---|---|---|
| 5,139 | Property, Plant and Equipment | 350 | 193 | 400 |
| 5,139 | TOTAL APPROPRIATION | 350 | 193 | 400 |
Advice and Support Services
This appropriation is intended to enable and facilitate decision-making by executive government through the delivery of policy advice and support services to the Prime Minister, Cabinet and its committees, the Executive Council and the Governor‑General.
What we achieved
| Performance measure | Target 2024/25 |
Result 2023/24 |
Result 2024/25 |
Achieved |
|---|---|---|---|---|
| The Prime Minister is satisfied with the services and support provided by the Department of the Prime Minister and Cabinet | 4 | 4.25 | 4.17 | ✔ |
| The Governor-General is satisfied with the services and support provided by the Department of the Prime Minister and Cabinet | 4 | 4.21 | 4.42 | ✔ |
How Prime Minister and Governor-General satisfaction is calculated
The satisfaction of the Prime Minister and Governor-General with the services and support provided by the Department of the Prime Minister and Cabinet is an aggregated result from all satisfaction measures in the Prime Minister portfolio and the Governor-General satisfaction measures contained in the Advice and Support Services Multi-Category Appropriation that have a reported result.
Satisfaction is measured on a scale from 1 to 5, where 1 means never met expectations and 5 means always met expectations.
How much it cost
| 2023/24 Actual $000 |
2024/25 Actual $000 |
2024/25 Budget $000 |
2024/25 Supp. Estimates $000 |
|
|---|---|---|---|---|
| 55,081 | Revenue Crown | 50,810 | 47,722 | 50,797 |
| 860 | Revenue Department | 1,052 | 1,192 | 1,674 |
| 166 | Revenue Other | 321 | 40 | 118 |
| 56,107 | TOTAL REVENUE | 52,183 | 48,954 | 52,589 |
| 49,639 | Departmental Expenses | 47,695 | 48,954 | 52,589 |
| 6,468 | Net Surplus/(Deficit) | 4,488 | - | - |
| 2,817 | Non-departmental Expenses | 2,080 | 2,527 | 2,307 |
| 857 | Non-departmental Capital Expenditure | 346 | 550 | 750 |
Departmental expenditure was lower than both the Budget and Supplementary Estimates of Appropriations mainly due to vacancies and reduced professional services costs, and two initiatives not proceeding as planned. This was partly offset by higher than expected utility and occupancy costs for the Government Houses.
Non-departmental expenditure was underspent against the Supplementary Estimates of Appropriations due to lower than anticipated spend for Government House planned maintenance and capital projects. This is mainly the result of lower than anticipated project costs.
Category: Advice and Support to Government and the Governor‑General
This category is intended to provide policy advice to support decision-making by the Prime Minister and the Prime Minister and Cabinet and provide support services to the Prime Minister, Cabinet and its committees, the Executive Council and the Governor-General.
What we achieved
| Performance measure | Target 2024/25 |
Result 2023/24 |
Result 2024/25 |
Achieved |
|---|---|---|---|---|
| Advice to Government | ||||
| The Prime Minister is satisfied with the policy advice service including advice on delivery | 4 | 4 | 5 | ✔ |
| The portfolio ministers are satisfied with the policy advice service for national security, risk and resilience | 4 | New measure | 3.50 | ✗ |
| Average score for assessed policy papers | 4 | 3.17 | 3.61 | ✗ |
| Quality of policy advice papers - 70% score 3 or higher, 30% score 4 or higher and no more than 10% score 2 or less | Achieved | Partially achieved | Achieved | ✔ |
| Ministerial satisfaction with the leadership of the national resilience, national security and emergency management systems | 4 | New measure | 4 | ✔ |
| Risk-coordinating agencies are satisfied with the leadership of the National Resilience System | 4 | New measure | 3.81 | ✗ |
| Average score of a sample of intelligence assessments reviewed by an external reviewer | 4 | 4.07 | 3.81 | ✗ |
| Percentage of projects under the Cyber Security Strategy work programme on track to meet key delivery and funding milestones, as reported to the Cyber Security Strategy Coordination Committee (CSSCC) | 80% | New measure | 75% | ✗ |
| Responses to ministerial Official Information Act 1982 (OIA) requests provided within agreed timeframes | 95% | 98.8% | 100% | ✔ |
| Support to the Prime Minister, Cabinet and the Governor-General | ||||
| The Prime Minister is satisfied with the support, secretariat and coordination services provided | 4 | 4 | 4 | ✔ |
| Cabinet and Cabinet committee minutes requiring subsequent amendment (excluding amendments made as the result of Cabinet decisions) | 0.5% | 0.3% | 0.0% | ✔ |
| Policy papers for Cabinet and Cabinet committee meetings will be published on CabNet by the close of business, two days before the meeting (subject to on-time lodgement in CabNet) | 90% | 90% | 99.55% | ✔ |
| Cabinet minutes will be published on CabNet by the close of business, three days after the Cabinet meeting | 95% | 98% | 98.68% | ✔ |
| The Governor-General is satisfied with the advisory and constitutional services provided | 4 | 4.42 | 4.42 | ✔ |
| The Governor-General is satisfied with the programme and household services provided | 4 | 4 | 4.42 | ✔ |
Why these measures were chosen
The performance measures in the Advice and Support Services multi category appropriation were selected as they are core to DPMC supporting the Governor-General, Prime Minister and Ministers to undertake their roles effectively. These measures best reflect that DPMC's role of supporting well-conducted government is delivered through the provision of high-quality advice and support, and that systems and institutions of executive government are trusted and effective.
Why we did not achieve one of our Ministerial satisfaction targets
The Prime Minister and Minister for National Security and Intelligence reported satisfaction with the policy advice provided by DPMC as 3.50 out of 5 (expectations met more than half the time) in 2024/25. This new measure reflects a broader scope of policy advice provided to the Minister from two separate business units. DPMC regularly receives feedback and remains committed to continuous improvement in the delivery of our policy advice to Ministers.
Why we did not achieve our policy quality target
We set two measures of policy quality, one an average score and one on the distribution of scores. This year, we achieved the distribution measure and did not achieve the average score measure.
A random sample of our policy papers was assessed with an in-house review panel. We met all three components of the distribution measure: 100% of our papers scored 3 or higher and no papers scored 2 or below and 35.71% of our papers scored 4 or above. We made a significant improvement on last year's result, however are still below our target. Overall, our results show that our work to improve our policy advice still has room to improve. We will continue to focus on implementing the recommendations of the review to help us further improve our advice and work towards achieving our ambitious targets.
How advice and services provided by Cabinet Office and Government House is measured
The Prime Minister and Governor-General are surveyed annually on their satisfaction with advice and services provided by DPMC. The Governor-General's satisfaction with support provided by DPMC is measured using separate surveys administered by the Cabinet Office and Government House.
Changes in performance measurement
The following measure was added in the Estimates of Appropriations 2024/25 as funding under the Cyber Security appropriation was incorporated in the Advice and Support Services multi category appropriation:
- Percentage of projects under the Cyber Security Strategy work programme on track to meet key delivery and funding milestones, as reported to the Cyber Security Strategy Coordination Committee (CSSCC).
The following changes in performance measurement were made in the Supplementary Estimates of Appropriations 2024/25.
- The following measures were removed due to changes in support for these portfolios: Lead Coordination Minister for the Government's Response to the RCOI Report into the Terrorist Attack on the Christchurch Mosques, and Minister for Infrastructure.
- The Lead Coordination Minister for the Government's Response to the Royal Commission of Inquiry's (RCOI) Report into the Terrorist Attack on the Christchurch Mosques is satisfied with the leadership, co-ordination and collaboration within the response to the RCOI's report.
- The Minister for Infrastructure is satisfied with the advice and support on the critical infrastructure resilience programme.
The following measures were removed in order to combine separate satisfaction measures for the policy advice service and the advice and support provided by the Delivery Unit, reflecting their shared focus in providing the Prime Minister with advice on the Government's priorities and their delivery:
- The Prime Minister is satisfied with the policy advice.
- The Prime Minister is satisfied with the advice and support provided by the Delivery Unit.
The following measures were removed to combine separate satisfaction measures for the Prime Minister and Minister for National Security and Intelligence:
- The Minister for National Security and Intelligence is satisfied with the policy advice service.
- The Prime Minister is satisfied with the advice and governance services to support national risk and strengthening resilience.
- The Prime Minister is satisfied with the provision of intelligence assessments that support national security priorities.
The following measure was added in order to combine separate satisfaction measures for the Prime Minister and Minister for National Security and Intelligence:
- The portfolio ministers are satisfied with the policy advice service for national security, risk and resilience.
The following measures were added to reflect DPMC's enduring role in leading the National Resilience System:
- Ministerial satisfaction with the leadership of the national resilience, national security and emergency management systems.
- Risk-coordinating agencies are satisfied with the leadership of the National Resilience System.
The following measure was added to reflect the support provided by DPMC to its portfolio Ministers (Prime Minister, Minister for National Security and Intelligence, and Minister for Emergency Management and Recovery) on requests made to them under the OIA.
- Responses to ministerial Official Information Act 1982 (OIA) requests provided within agreed timeframes.
The following measure was revised from measuring publication timeliness of all papers, to measuring timeliness of policy papers reflecting a change in the prioritisation of policy papers for publication:
- Policy papers for Cabinet and Cabinet committee meetings will be published on CabNet by the close of business, two days before the meeting (subject to on-time lodgement in CabNet).
The following measure was removed due to an exemption being granted under section 15D(2)(b)(iii) of the Public Finance Act 1989. The appropriation is one from which resources was provided to a person or an entity other than a department, a functional chief executive, an Officer of Parliament, or a Crown entity, under section 15D(2)(b)(iii) of the Public Finance Act 1989, as the amount of this annual appropriation for a Non-Departmental other expense is less than $5 million expenditure:
- The Prime Minister is satisfied with the scientific advice provided.
How much it cost
| 2023/24 Actual $000 |
2024/25 Actual $000 |
2024/25 Budget $000 |
2024/25 Supp. Estimates $000 |
|
|---|---|---|---|---|
| 55,081 | Revenue Crown | 50,810 | 47,722 | 50,797 |
| 860 | Revenue Department | 1,052 | 1,192 | 1,674 |
| 166 | Revenue Other | 321 | 40 | 118 |
| 56,107 | TOTAL REVENUE | 52,183 | 48,954 | 52,589 |
| 49,639 | Departmental Expenses | 47,695 | 48,954 | 52,589 |
| 6,468 | Net Surplus/(Deficit) | 4,488 | - | - |
Emergency Management Leadership and Support
This appropriation is intended to achieve an all-hazards, all-risks emergency management system that reduces risk, and is ready and able to, and assist recovery from, emergencies.
What we achieved
| Performance measure | Target 2024/25 |
Result 2023/24 |
Result 2024/25 |
Achieved |
|---|---|---|---|---|
| The National Emergency Management Agency maintains a positive public reputation index score | At least 5 points above | 71% | 71% | ✔ |
| Overall preparedness - New Zealanders are actively preparing for emergencies and know how to protect themselves against life safety risks posed by our most dangerous natural hazards | 66% | 61% | 61% | ✗ |
How positive reputation was measured
Maintaining a positive reputation is measured using the Public Sector Reputation Index. Reputation is measured across 16 attributes, under the four pillars of trust, social responsibility, leadership and fairness which are combined into a single reputation score.
The average public reputation score allows agencies to understand scores relative to other agencies and to track progress over time. NEMA's public reputation score in 2024/25 was 71, above the average of 64.
How preparedness was measured and why this target was not achieved
The overall preparedness measure is an average of the results contained in the Community Awareness and Readiness measures.
Preparedness is measured using the annual Disaster Preparedness Survey. This surveys people in New Zealand to assess disaster preparedness and the effectiveness of the public education programme.
Research shows that the biggest motivator for preparedness is a significant emergency event, and the absence of these events mean preparedness actions tend to decline. Work to promote preparedness is ongoing and remains a priority.
How much it cost
| 2023/24 Actual $000 |
2024/25 Actual $000 |
2024/25 Budget $000 |
2024/25 Supp. Estimates $000 |
|
|---|---|---|---|---|
| 56,087 | Revenue Crown | 54,969 | 49,752 | 54,980 |
| 102 | Revenue Department | 948 | 230 | 1,507 |
| 1,130 | Revenue Other | 108 | - | 108 |
| 57,319 | TOTAL REVENUE | 56,025 | 49,982 | 56,595 |
| 49,108 | Departmental Expenses | 51,502 | 49,982 | 56,595 |
| 8,211 | Net Surplus/(Deficit) | 4,523 | - | - |
| 14,453 | Non-departmental Expenses | 19,408 | 12,526 | 20,576 |
| - | Non-departmental Capital Expenses | - | - | - |
Departmental expenditure was higher than originally budgeted due to expenditure related to funding carried forward from 2022/23 plus support for Pacific disaster readiness, for which budget was included in the Supplementary Estimates of Appropriations. The underspend against the Supplementary Estimates of Appropriations was mainly due to lower expenditure for North Island extreme weather events response and recovery and maintenance of the Tsunami Detection Network occurring later in the year than assumed, resulting in it continuing into 2024/25.
Non-departmental expenditure was higher than originally budgeted due to expenditure related to funding carried forward from 2022/23 for several emergency management initiatives, including support for communities impacted by the 2023 North Island extreme weather events. Budget for these items carried forward was included in the Supplementary Estimates of Appropriations.
The underspend against the Supplementary Estimates of Appropriations is mainly due to lower expenditure than budgeted to support emergency readiness and response activities, including support for communities impacted by the 2023 North Island extreme weather events where the level of eligible claims was lower than expected.
Category: Advice and Support for Emergency Risk Reduction, Readiness, Response and Recovery
This category is intended to achieve the provision of advice to Ministers and the emergency management sector on the design, operation and performance of the emergency management system; building the capability and capacity of the emergency management sector (including communities) to plan for, respond to and recover from, emergencies; and leading and supporting response to and recovery from emergencies.
What we achieved
| Performance measure | Target 2024/25 |
Result 2023/24 |
Result 2024/25 |
Achieved |
|---|---|---|---|---|
| Community Awareness and Readiness | ||||
| Percentage of New Zealanders who have taken action to prepare for an emergency in the last 12 months | 50% | 38% | 40% | ✗ |
| Percentage of New Zealanders who know the correct action to take during an earthquake | 67% | 59% | 59% | ✗ |
| Percentage of New Zealanders who know the correct action to take if they feel a long or strong earthquake near the coast | 85% | 86% | 84% | ✗ |
| Emergency Sector Support and Management | ||||
| Satisfaction is at least 6 out of 10 in relation to the two measures below: | ||||
| if a Guideline, Technical Standard, or Code was required did it meet the CDEM sector users' needs | 6 | 7.7 | 9.1 | ✔ |
| the National Emergency Management Agency supports capability development by facilitating learning and training activities for organisations with responsibilities under the Civil Defence Emergency Management Act 2002 | 6 | 7.1 | 8.5 | ✔ |
| Number of Tsunami Monitoring and Detection buoys maintained to minimum manufacturer's standard | 12 | 12 | 12 | ✔ |
| Management of Emergencies | ||||
| Number of times the National Emergency Management Agency improvement action plan is reviewed | 4 | 3 | 5 | ✔ |
| Policy Advice | ||||
| The Minister for Emergency Management and Recovery is satisfied with the policy advice service provided by the National Emergency Management Agency | 4 | 4.86 | 4 | ✔ |
| Average score for assessed policy papers | 4 | 3.08 | 3.00 | ✗ |
| Quality of policy advice papers - 70% score 3 or higher, 30% score 4 or higher and no more than 10% score 2 or less | Achieved | Partially achieved | Not achieved | ✗ |
Why these measures were chosen
The performance measures in the Emergency Management Leadership and Support appropriation were selected as they are core to NEMA's work in positively changing public behaviours to emergency preparedness. The measures also reflect NEMA's role in providing an effective and integrated response to, and recovery from, emergencies.
How preparedness was measured and why three targets were not achieved
Preparedness is measured using the annual Emergency Preparedness Survey. This surveys people in New Zealand to assess emergency preparedness and the effectiveness of the public education programme.
This year, of the three measures, one had a positive improvement, one was unchanged and one had a slight decline which aligns with where we focused our campaign efforts. These were Percentage of New Zealanders who have taken action to prepare for an emergency in the last 12 months, and Percentage of New Zealanders who have taken action to prepare for an emergency in the last 12 months. A successful ShakeOut campaign with over 676,000 participants positively contributed to this measure.
Research shows that the biggest motivator for preparedness is a significant emergency event, and the absence of these events mean preparedness actions tend to decline. Work to promote preparedness is ongoing and remains a priority.
How satisfaction with Guidelines, Technical Standards, or Codes is measured
A survey is completed by approximately 300 NEMA stakeholders across local and central government on their satisfaction with relevant NEMA publications. This is measured on a scale from 1-10, where 1 means has not met needs and 10 means exceeded needs. Relevant publications are those found on the National Emergency Management Agency website https://www.civildefence.govt.nz/resources/publications.
How satisfaction with capability development and training is measured
An evaluation survey is completed by participants of NEMA-led courses on the guidance and support to the CDEM sector. This is measured on a scale from 1-10, where 1 means has not met needs and 10 means exceeded needs.
How the National Emergency Management Agency improvement action plan measure is assessed
The NEMA Senior Management Team, or approved subcommittee, in the financial year and ensures target dates are on track (or adjusts target dates when events outside NEMA's control occur, such as natural disasters).
Why we did not achieve the policy quality targets
NEMA did not achieve the average score measure or the distribution measure. Due to the small sample size of six papers assessed, the percentages reported will show higher degrees of variation than a larger sample size. This year we met one of the three components of the distribution measure: 33.33% of our papers scored 4 or higher (the same as in 2023/24).
There was an increase in the percentage of papers scored a 2 or below (33.33% up from 16.67% in 2023/24). While we have maintained a high percentage of papers scoring a 4 or higher, our scores show that our work to improve our policy advice still has room to improve, particularly improving our analysis, including communicating data and evidence. We will continue to focus on implementing the recommendations of the review to help us further improve our advice and work towards achieving our ambitious targets.
How much it cost
| 2023/24 Actual $000 |
2024/25 Actual $000 |
2024/25 Budget $000 |
2024/25 Supp. Estimates $000 |
|
|---|---|---|---|---|
| 56,087 | Revenue Crown | 54,969 | 49,752 | 54,980 |
| 102 | Revenue Department | 948 | 230 | 1,507 |
| 1,130 | Revenue Other | 108 | - | 108 |
| 57,319 | TOTAL REVENUE | 56,025 | 49,982 | 56,595 |
| 49,108 | Departmental Expenses | 51,502 | 49,982 | 56,595 |
| 8,211 | Net Surplus/(Deficit) | 4,523 | - | - |
Our financials#
Tauāki pūtea
This section contains our financial statements for 2024/25 which report on the financial resources used by DPMC to deliver the goods and services purchased by our Ministers, as well as financial statements, notes and other explanatory information.
Statement of responsibility#
I am responsible, as the Chief Executive of the Department of the Prime Minister and Cabinet (the Department), for:
- the preparation of the Department's Financial Statements, and Statements of Expenses and Capital Expenditure, and for the judgements expressed in them
- having in place a system of internal control designed to provide reasonable assurance as to the integrity and reliability of financial reporting
- ensuring that end-of-year performance information on each appropriation administered by the Department is provided in accordance with sections 19A to 19C of the Public Finance Act 1989, whether or not that information is included in this Annual Report, and
- the accuracy of any end-of-year performance information prepared by the Department, whether or not that information is included in the Annual Report.
In my opinion:
- the annual report fairly reflects the operations, progress, and the organisational health and capability of the Department
- the Financial Statements fairly reflect the financial position of the Department as at 30 June 2025 and its operations for the year ended on that date, and
- the Forecast Financial Statements fairly reflect the forecast financial position of the Department as at 30 June 2026 and its operations for the year ending on that date.
Ben King
Secretary of the Department of the Prime Minister and Cabinet, and Chief Executive
Te Tumu Whakarae mō Te Tari o te Pirimia me te Komiti Matua
Date: 30 September 2025
Independent Auditor’s Report#
To the readers of Department of the Prime Minister and Cabinet’s annual report for the year ended 30 June 2025
The Auditor-General is the auditor of the Department of the Prime Minister and Cabinet (the ‘Department’). The Auditor-General has appointed me, Anthony Heffernan, using the staff and resources of Audit New Zealand, to carry out, on his behalf, the audit of:
- The annual financial statements of the Department that comprise the statement of financial position, statement of commitments, statement of contingent liabilities and contingent assets as at 30 June 2025, the statement of comprehensive revenue and expenses, statement of changes in equity, and statement of cash flows for the year ended on that date and the notes to the financial statements that include accounting policies and other explanatory information on pages 70 to 89.
- The end-of-year performance information for appropriations of the Department for the year ended 30 June 2025 on pages 4 to 21, 46 to 50, and 55 to 62.
- The statements of expenses and capital expenditure of the Department for the year ended 30 June 2025 on pages 51 to 54.
- The schedules of non-departmental activities which are managed by the Department on behalf of the Crown on pages 90 to 100 that comprise:
- the schedules of assets; liabilities; commitments; and contingent liabilities and assets as at 30 June 2025;
- the schedules of expenses; and revenue and receipts for the year ended 30 June 2025; and
- the notes to the schedules that include accounting policies and other explanatory information.
Opinion
In our opinion:
- The annual financial statements of the Department:
- fairly present, in all material respects:
- its financial position as at 30 June 2025; and
- its financial performance and cash flows for the year ended on that date; and
- comply with generally accepted accounting practice in New Zealand in accordance with Public Benefit Entity Standards.
- fairly present, in all material respects:
- The end-of-year performance information for appropriations:
- provides an appropriate and meaningful basis to enable readers to assess what has been achieved with each appropriation; determined in accordance with generally accepted accounting practice in New Zealand; and
- fairly presents, in all material respects:
- what has been achieved with each appropriation; and
- the actual expenses or capital expenditure incurred in relation to each appropriation as compared with the expenses or capital expenditure that were appropriated or forecast to be incurred; and
- complies with generally accepted accounting practice in New Zealand in accordance with Public Benefit Entity Standards.
- The statements of expenses and capital expenditure have been prepared, in all material respects, in accordance with the requirements of section 45A of the Public Finance Act 1989.
- The schedules of non-departmental activities which are managed by the Department on behalf of the Crown have been prepared, in all material respects, in accordance with the Treasury Instructions. The schedules comprise:
- the assets, liabilities, commitments, and contingent liabilities and assets as at 30 June 2025; and
- expenses, and revenue and receipts for the year ended 30 June 2025.
Our audit was completed on 30 September 2025. This is the date at which our opinion is expressed.
Basis for our opinion
We carried out our audit in accordance with the Auditor-General’s Auditing Standards, which incorporate the Professional and Ethical Standards, the International Standards on Auditing (New Zealand), and New Zealand Auditing Standard 1 (Revised): The Audit of Service Performance Information issued by the New Zealand Auditing and Assurance Standards Board. Our responsibilities under those standards are further described in the Responsibilities of the auditor section of our report.
We have fulfilled our responsibilities in accordance with the Auditor-General’s Auditing Standards.
We believe that the audit evidence we have obtained is sufficient and appropriate to provide a basis for our audit opinion.
Responsibilities of the Chief Executive for the information to be audited
The Chief Executive is responsible on behalf of the Department for preparing:
- Annual financial statements that fairly present the Department’s financial position, financial performance, and its cash flows, and that comply with generally accepted accounting practice in New Zealand.
- End-of-year performance information for appropriations that:
- provides an appropriate and meaningful basis to enable readers to assess what has been achieved with each appropriation; determined in accordance with generally accepted accounting practice in New Zealand;
- fairly presents what has been achieved with each appropriation;
- fairly presents the actual expenses or capital expenditure incurred in relation to each appropriation as compared with the expenses or capital expenditure that were appropriated or forecast to be incurred; and
- complies with generally accepted accounting practice in New Zealand.
- Statements of expenses and capital expenditure of the Department, that are prepared in accordance with section 45A of the Public Finance Act 1989.
- Schedules of non-departmental activities, prepared in accordance with the Treasury Instructions, of the activities managed by the Department on behalf of the Crown.
The Chief Executive is responsible for such internal control as is determined is necessary to enable the preparation of the information to be audited that is free from material misstatement, whether due to fraud or error.
In preparing the information to be audited, the Chief Executive is responsible on behalf of the Department for assessing the Department’s ability to continue as a going concern.
The Chief Executive’s responsibilities arise from the Public Finance Act 1989.
Responsibilities of the auditor for the information to be audited
Our objectives are to obtain reasonable assurance about whether the information we audited, as a whole, is free from material misstatement, whether due to fraud or error, and to issue an auditor’s report that includes our opinion.
Reasonable assurance is a high level of assurance, but is not a guarantee that an audit carried out in accordance with the Auditor-General’s Auditing Standards will always detect a material misstatement when it exists. Misstatements are differences or omissions of amounts or disclosures, and can arise from fraud or error. Misstatements are considered material if, individually or in the aggregate, they could reasonably be expected to influence the decisions of readers, taken on the basis of the information we audited.
For the budget information reported in the information we audited, our procedures were limited to checking that the information agreed to the Estimates of Appropriations for the Government of New Zealand for the Year Ending 30 June 2025. For the forecast financial information for the year ending 30 June 2026, our procedures were limited to checking to the best estimate financial forecast information based on the Budget Economic Fiscal Update for the year ending 30 June 2026.
We did not evaluate the security and controls over the electronic publication of the information we audited.
As part of an audit in accordance with the Auditor-General’s Auditing Standards, we exercise professional judgement and maintain professional scepticism throughout the audit. Also:
- We identify and assess the risks of material misstatement of the information we audited, whether due to fraud or error, design and perform audit procedures responsive to those risks, and obtain audit evidence that is sufficient and appropriate to provide a basis for our opinion. The risk of not detecting a material misstatement resulting from fraud is higher than for one resulting from error, as fraud may involve collusion, forgery, intentional omissions, misrepresentations, or the override of internal control.
- We obtain an understanding of internal control relevant to the audit in order to design audit procedures that are appropriate in the circumstances, but not for the purpose of expressing an opinion on the effectiveness of the Department’s internal control.
- We evaluate the appropriateness of accounting policies used and the reasonableness of accounting estimates and related disclosures made by the Chief Executive
- We evaluate whether the end-of-year performance information for appropriations:
- provides an appropriate and meaningful basis to enable readers to assess what has been achieved with each appropriation. We make our evaluation by reference to generally accepted accounting practice in New Zealand; and
- fairly presents what has been achieved with each appropriation.
- We evaluate whether the statements of expenses and capital expenditure have been prepared in accordance with legislative requirements.
- We conclude on the appropriateness of the use of the going concern basis of accounting by the Chief Executive.
- We evaluate the overall presentation, structure and content of the information we audited, including the disclosures, and whether the information we audited represents the underlying transactions and events in a manner that achieves fair presentation.
We communicate with the Chief Executive regarding, among other matters, the planned scope and timing of the audit and significant audit findings, including any significant deficiencies in internal control that we identify during our audit.
Our responsibilities arise from the Public Audit Act 2001.
Other information
The Chief Executive is responsible for the other information. The other information comprises all of the information included in the annual report other than the information we audited and our auditor’s report thereon.
Our opinion on the information we audited does not cover the other information and we do not express any form of audit opinion or assurance conclusion thereon.
Our responsibility is to read the other information. In doing so, we consider whether the other information is materially inconsistent with the information we audited or our knowledge obtained in the audit, or otherwise appears to be materially misstated. If, based on our work, we conclude that there is a material misstatement of this other information, we are required to report that fact. We have nothing to report in this regard.
The Minister of Emergency Management and Recovery’s report on relevant non-departmental appropriations that is appended to the Department’s annual report is not part of the Department’s annual report. The Public Finance Act 1989 does not require the information in the Minister’s report to be audited and we have performed no procedures over the information in the Minister’s report.
Independence
We are independent of the Department in accordance with the independence requirements of the Auditor-General’s Auditing Standards, which incorporate the independence requirements of Professional and Ethical Standard 1: International Code of Ethics for Assurance Practitioners (including International Independence Standards) (New Zealand) issued by the New Zealand Auditing and Assurance Standards Board.
Other than in our capacity as auditor, we have no relationship with, or interests, in the Department.
Anthony Heffernan
Audit New Zealand
On behalf of the Auditor-General
Wellington, New Zealand
Departmental financial statements#
Statement of Comprehensive Revenue and Expenses
for the year ended 30 June 2025
| 2023/24 Actual $000 |
Note | 2024/25 Actual $000 |
2024/25 Unaudited Budget $000 |
2025/26 Unaudited Forecast $000 |
|
|---|---|---|---|---|---|
| REVENUE | |||||
| 128,156 | Revenue Crown | 2 | 114,975 | 111,422 | 113,100 |
| 2,257 | Other Revenue | 2 | 2,430 | 1,462 | 560 |
| 130,413 | TOTAL REVENUE | 117,405 | 112,884 | 113,660 | |
| EXPENSES | |||||
| 66,615 | Personnel Costs | 3 | 62,725 | 63,559 | 62,830 |
| 440 | Depreciation and Amortisation Expense | 8, 9 | 1,019 | 985 | 1,795 |
| 592 | Capital Charge | 4 | 735 | 675 | 740 |
| 40,398 | Other Operating Expenses | 5 | 42,100 | 47,665 | 48,295 |
| 108,045 | TOTAL EXPENDITURE | 106,579 | 112,884 | 113,660 | |
| 22,368 | NET SURPLUS/(DEFICIT) | 10,826 | - | - | |
| - | Other Comprehensive Revenue and Expenses | - | - | - | |
| 22,368 | TOTAL COMPREHENSIVE REVENUE AND EXPENSES | 10,826 | - | - |
Statement of Changes in Equity#
for the year ended 30 June 2025
| 2023/24 Actual $000 |
Note | 2024/25 Actual $000 |
2024/25 Unaudited Budget $000 |
2025/26 Unaudited Forecast $000 |
|
|---|---|---|---|---|---|
| 11,848 | Balance at 1 July | 14,708 | 14,708 | 14,801 | |
| 22,368 | Surplus for the Year | 10,826 | - | - | |
| 2,860 | Capital Injection | - | 93 | 2,270 | |
| (22,368) | Return of Operating Surplus to the Crown | 12 | (10,826) | - | - |
| 14,708 | BALANCE AT 30 JUNE | 14,708 | 14,801 | 17,071 |
Statement of Financial Position#
as at 30 June 2025
| 2023/24 Actual $000 |
Note | 2024/25 Actual $000 |
2024/25 Unaudited Budget $000 |
2025/26 Unaudited Forecast $000 |
|
|---|---|---|---|---|---|
| ASSETS | |||||
| CURRENT ASSETS | |||||
| 10,453 | Cash and Cash Equivalents | 6 | 11,630 | 10,000 | 10,000 |
| 35,706 | Debtor Crown | 2 | 24,544 | 22,529 | 16,226 |
| 1,081 | Other Receivables | 7 | 403 | 544 | 1,060 |
| 116 | Prepayments | 58 | 154 | 116 | |
| 328 | Inventory | 289 | 307 | 328 | |
| 47,684 | TOTAL CURRENT ASSETS | 36,924 | 33,534 | 27,730 | |
| NON-CURRENT ASSETS | |||||
| 5,999 | Property, Plant and Equipment | 8 | 5,320 | 5,011 | 5,955 |
| 11 | Intangible Assets | 9 | - | 5 | 6 |
| 6,010 | TOTAL NON-CURRENT ASSETS | 5,320 | 5,016 | 5,961 | |
| 53,694 | TOTAL ASSETS | 42,244 | 38,550 | 33,691 | |
| LIABILITIES | |||||
| CURRENT LIABILITIES | |||||
| 10,981 | Payables | 10 | 10,148 | 18,975 | 12,492 |
| - | Provision for Restructuring Costs | 11 | 1,077 | - | - |
| 22,368 | Provision for Repayment of Surplus | 12 | 10,826 | - | - |
| 5,353 | Employee Entitlements | 13 | 5,218 | 4,774 | 4,128 |
| 38,702 | TOTAL CURRENT LIABILITIES | 27,269 | 23,749 | 16,620 | |
| NON-CURRENT LIABILITIES | |||||
| 284 | Employee Entitlements | 13 | 267 | - | - |
| 284 | TOTAL NON-CURRENT LIABILITIES | 267 | - | - | |
| 38,986 | TOTAL LIABILITIES | 27,536 | 23,749 | 16,620 | |
| 14,708 | NET ASSETS | 14,708 | 14,801 | 17,071 | |
| EQUITY | |||||
| 14,708 | Taxpayers' Funds | 14,708 | 14,801 | 17,071 | |
| 14,708 | TOTAL EQUITY | 14,708 | 14,801 | 17,071 |
Statement of Cash Flows#
for the year ended 30 June 2025
| 2023/24 Actual $000 |
Note | 2024/25 Actual $000 |
2024/25 Unaudited Budget $000 |
2025/26 Unaudited Forecast $000 |
|
|---|---|---|---|---|---|
| CASH FLOWS FROM OPERATING ACTIVITIES | |||||
| 156,169 | Receipts from the Crown | 126,137 | 122,951 | 123,417 | |
| 2,029 | Receipts from Other Revenue | 3,499 | 1,462 | 560 | |
| (45,883) | Payments to Suppliers | (39,727) | (47,750) | (48,372) | |
| (66,487) | Payments to Employees | (63,582) | (63,474) | (62,753) | |
| (592) | Payments for Capital Charge | (735) | (675) | (740) | |
| (3,089) | Goods and Services Tax (net) | (1,697) | - | - | |
| 42,147 | NET CASH FLOWS FROM OPERATING ACTIVITIES | 14 | 23,895 | 12,514 | 12,112 |
| CASH FLOWS FROM INVESTING ACTIVITIES | |||||
| (5,139) | Purchases of Property, Plant and Equipment | (350) | (193) | (2,370) | |
| (5,139) | NET CASH FLOWS FROM INVESTING ACTIVITIES | (350) | (193) | (2,370) | |
| CASH FLOWS FROM FINANCING ACTIVITIES | |||||
| (35,373) | Repayment of Net Surplus to the Crown | (22,368) | (12,414) | (12,012) | |
| 2,860 | Capital Contributions | - | 93 | 2,270 | |
| (32,513) | NET CASH FROM FINANCING ACTIVITIES | (22,368) | (12,321) | (9,742) | |
| 4,495 | Net Increase/(Decrease) in Cash and Cash Equivalents | 1,177 | - | - | |
| 5,958 | Cash and cash equivalents at the beginning of the year | 10,453 | 10,000 | 10,000 | |
| 10,453 | CASH AND CASH EQUIVALENTS AT END OF THE YEAR | 11,630 | 10,000 | 10,000 | |
Explanations of major variances against the original budget are provided in Note 17.
The accompanying notes and policies form part of these Financial Statements.
Statement of Commitments #
as at 30 June 2025
Capital commitments
At 30 June 2025, the Department has no capital commitments (2024: Nil).
Non-cancellable operating lease commitments
The Department leases premises in Wellington, Auckland and Christchurch. These non-cancellable operating leases have varying terms, escalation clauses and renewal rights. In Wellington, the Department leases several floors in 23 Kate Sheppard Place, and at Pipitea House. In Auckland, office space is leased from another government agency for Auckland-based Department of the Prime Minister and Cabinet and National Emergency Management Agency staff. In Christchurch, office space is leased at 158 High Street, Christchurch and within the Christchurch Justice and Emergency Services Precinct. The amounts disclosed below as future commitments are based on the current rental rates.
There are no restrictions placed on the Department by any of the operating lease arrangements.
| 2023/24 Actual $000 |
2024/25 Actual $000 |
|
|---|---|---|
| OPERATING COMMITMENTS | ||
| NON-CANCELLABLE OPERATING LEASE COMMITMENTS | ||
| 2,552 | No later than one year | 2,614 |
| 10,208 | Later than one year and not later than 5 years | 10,006 |
| 2,548 | Later than five years | 558 |
| 15,308 | TOTAL NON-CANCELLABLE OPERATING LEASE COMMITMENTS | 13,178 |
Statement of Contingent Liabilities and Contingent Assets#
as at 30 June 2025
Contingent liabilities
At 30 June 2025, the Department has no contingent liabilities. (2024: Two).
Contingent assets
At 30 June 2025, the Department has no contingent assets (2024: Nil).
The accompanying notes and policies form part of these Financial Statements.
Notes to the Departmental financial statements#
for the year ended 30 June 2025
1. Statement of Accounting Policies
Reporting entity
The Department of the Prime Minister and Cabinet (the ‘Department') is a New Zealand government department defined by section 5 of the Public Service Act 2020 and is domiciled and operates in New Zealand. The relevant legislation governing the Department's operations includes the Public Finance Act 1989 (PFA) and the Public Service Act 2020. The Department's ultimate parent is the New Zealand Crown.
The Department's primary objective is to provide services to the New Zealand public and does not operate to make a financial return. It operates as the advisor, leader and steward of New Zealand's system of executive government.
The Department has designated itself as a public benefit entity (PBE) for the purposes of complying with generally accepted accounting practices in New Zealand (NZ GAAP).
The financial statements of the Department are for the year ended 30 June 2025 and were approved for issue by the Chief Executive on 30 September 2025.
In addition, the Department has reported on Crown activities that it administers in the non-departmental statements and schedules on pages 90 to 100.
Basis of preparation
The financial statements have been prepared on a going concern basis, and the accounting policies have been applied consistently throughout the year.
Statement of compliance
The Departmental Financial Statements and the Forecast Financial Statements of the Department have been prepared in accordance with the requirements of the Public Finance Act 1989, which includes the requirement to comply with NZ GAAP, Treasury Instructions and Treasury Circulars and have been prepared in accordance with Tier 1 NZ PBE Accounting Standards as issued by the External Reporting Board.
Measurement base
The Departmental Financial Statements have been prepared on a historical-cost basis.
The accrual basis of accounting has been used.
Functional and presentation currency
The Departmental Financial Statements are presented in New Zealand dollars and all values are rounded to the nearest thousand dollars ($000). The functional currency of the Department is New Zealand dollars.
Other changes in accounting policies
There have been no changes in the Department's accounting policies since the date of the last audited financial statements.
Comparatives
When a presentation or classification of an item in the Departmental Financial Statements is amended or an accounting policy is changed voluntarily, comparative figures are restated to ensure consistency with the current period unless it is impracticable to do so.
The comparative financial period presented is 12 months. All comparative information is consistent with the previous year.
Standards issued and not yet effective and not early adopted
Standards and amendments issued but not yet effective and that have not been early adopted, and that are relevant to the Department are:
- The amendments to the PBE Conceptual Framework which include:
- Updates to the guidance on materiality.
- Additional guidance to clarify, when applying the qualitative characteristic of faithful representation, how prudence should be considered.
- Updates to the definitions of an asset and a liability and the related guidance.
- New guidance on the unit of account and on binding arrangements that are equally unperformed.
- The NZASB issued amendments to PBE IPSAS 1 to clarify the requirements for classifying liabilities as current or non-current, in particular:
- The conditions that exist at the reporting date are those that will be used to determine if a right to defer settlement of a liability exists. Specifically, only covenants with which an entity must comply on or before the reporting date will affect the classification of a liability.
- Management's intention or expectation does not affect the classification of liabilities.
- In cases where an instrument with a conversion option is classified as a liability, the transfer of equity instruments would constitute the settlement of the liability for classification purposes.
- Clarifying specific situations in which an entity does not have a right to defer settlement for at least 12 months after the reporting date.
- In addition, an entity is required to disclose when a liability arising from a loan agreement is classified as non-current and the entity's right to defer settlement is contingent on compliance with future covenants within 12 months.
Critical accounting estimates and assumptions
In preparing these Financial Statements, estimates and assumptions have been made concerning the future. These estimates and assumptions may differ from the subsequent actual results. Estimates and assumptions are continually evaluated and are based on historical experience and other factors, including expectations of future events that are believed to be reasonable under the circumstances. The estimates and assumptions that have a significant risk of causing a material adjustment relate to the measurement of long service and retirement leave (see Note 13).
Summary of significant accounting policies
Significant accounting policies are included in the notes to which they relate. Significant accounting policies that do not relate to a specific note are outlined below.
Financial instruments
Financial instruments of the Department are comprised of financial assets (cash, cash equivalents, debtors, other receivables) and financial liabilities (creditors, and other payables).
Recognition and de-recognition of financial assets and liabilities
Financial assets and financial liabilities are recognised when the Department becomes a party to the contractual provisions of the financial instrument.
Financial assets and financial liabilities are recognised initially at fair value plus transaction costs.
Financial assets are derecognised when the contractual rights to the cash flows from the financial asset expire, or the Department transfers the financial asset to another party without retaining control or transfers substantially all the risks and rewards of the asset.
A financial liability is derecognised when it is extinguished, discharged, cancelled or expires.
Subsequent measurement of financial assets
After initial recognition, all financial assets held by the Department are measured at amortised cost using the effective interest rate method, less any provisions for impairment.
Subsequent measurement of financial liabilities
All financial liabilities are designated at nominal value, unless the non-current amount is significant enough to warrant designation at amortised value using the effective interest rate method.
Goods and services tax
All items in the financial statements are stated exclusive of goods and services tax (GST), except for receivables and payables, which are stated on a GST-inclusive basis. Where GST is not recoverable as input tax, it is recognised as part of the related asset or expense.
The net amount of GST recoverable from, or payable to, the Inland Revenue (IR) is included as part of receivables or payables in the statement of financial position.
The net GST paid to or received from the IR, including the GST relating to investing and financing activities, is classified as an operating cash flow in the statement of cash flows. Commitments and contingencies are disclosed exclusive of GST.
Income tax
The Department is a public authority and consequently is exempt from income tax. Accordingly, no provision has been made for income tax.
Commitments
The Department's commitments are made up of future expenses and liabilities to be incurred on non-cancellable contracts at balance date.
Budget and forecast figures
The 2025 budget figures are consistent with the Department's best estimate financial forecast information submitted to the Treasury for the 2024 Budget Economic and Fiscal Update (BEFU) for the year ending 30 June 2025.
The 2026 forecast figures are for the year ending 30 June 2026, which are consistent with the best estimate financial forecast information submitted to the Treasury for the 2025 BEFU for the year ending 30 June 2026.
The forecast financial statements have been prepared as required by the Public Finance Act 1989 and prepared accordance with PBE FRS 42 Prospective Financial Statements.
The budget and forecast figures are unaudited and have been prepared using the accounting policies adopted in preparing these financial statements.
Prospective Financial Statements
The forecast financial statements were approved for issue by the Chief Executive on 4 April 2025.
The Chief Executive is responsible for the forecast financial statements, including the appropriateness of the assumptions underlying them and all other required disclosures.
Although the Department regularly updates its forecasts, updated forecast financial statements for the year ending 30 June 2026 will not be published.
Significant assumptions used in preparing the forecast financial information
The forecast figures contained in these financial statements reflect the Department's purpose and activities and are based on a number of assumptions on what might occur during the 2025/26 year. The forecast figures have been compiled on the basis of existing government policies and ministerial expectations at the time the Estimates of Appropriations 2025/26 were finalised.
The main assumptions which were adopted as at 4 April 2025 were as follows:
- with the exception of the matter mentioned below, the activities and output expectations will remain substantially the same as the previous year focusing on the Government's priorities
- the 2025/26 forecast has taken into account the disestablishment of the Chief Executive, Cyclone Recovery on 1 July 2025
- personnel costs were based on current wages and salary costs, adjusted for anticipated remuneration changes, and
- operating costs were based on historical experience and other factors that are believed to be reasonable in the circumstances and are the best estimate of future costs that will be incurred.
The actual financial results achieved for 30 June 2026 are likely to vary from the forecast information presented, and the variations might be material. Additional factors that could lead to material differences between the Forecast Financial Statements and the 2025/26 Actual Financial Statements include changes to the baseline budget through new initiatives, transfer of funding across financial years, structural changes or technical adjustments.
Since the forecasts were approved, two significant changes that would have a material effect on the forecast have occurred:
- On 7 April 2025 Cabinet agreed that responsibility for hosting the departmental agency, the National Emergency Management Agency, would transfer from the Department of the Prime Minister and Cabinet to the Department of Internal Affairs on 25 September 2025. The forecasts for 2025/26 reflect the appropriations in the Estimates of Appropriations 2025/26 prior to this decision. Joint Ministers have agreed to transfer $37.543 million from the Emergency Management Leadership and Support MCA, and transfer of capital of $5.019 million from Vote Prime Minister and Cabinet to Vote Internal Affairs to be recorded in the October Baseline Update.
- On 3 July 2025 a new structure for the Department was confirmed and communicated to all staff. The restructure will result in the Department moving from a headcount of 247 to 229 - a reduction of 18 roles.
Statement of cost accounting policies for Department Financial Statements
The cost accounting policies of the Department are used to allocate the expenditure incurred to the related appropriation as provided in the Appropriation Statements on pages 51 to 54. There have been no changes in cost accounting policies since the date of the last audited Financial Statements. The Department has determined the cost of outputs using the following cost allocation system:
- direct costs are expenses incurred from activities in producing outputs. These costs are charged directly to the related appropriations, and
- indirect costs are expenses incurred by the Strategy, Governance and Engagement Group. Indirect costs are allocated to appropriations based on full-time equivalent personnel numbers. Indirect costs include those costs incurred by the Central Agencies' Shared Services function within the Treasury and then recovered from DPMC.
2. Revenue
Accounting policy
Revenue Crown
Revenue from the Crown is measured based on the Department's funding entitlement for the reporting period. The funding entitlement is established by Parliament when it passes the Appropriation Bills for the financial year.
The amount of revenue recognised takes into account any amendments to appropriations approved in the Appropriation (Supplementary Estimates) Bill for the year and certain other unconditional funding adjustments formally approved prior to balance date.
There are no conditions attached to the funding from the Crown. However, the Department can incur expenses only within the scope and limits of its appropriations.
The fair value of Revenue Crown has been determined to be equivalent to the funding entitlement.
Debtor Crown represents amounts receivable from the Crown under normal appropriation arrangements. These arise where the Department has incurred expenditure in advance of receiving cash funding, or where revenue earned has not yet been received.
Receivables from the Crown are classified as non-exchange receivables and are measured at face value, as they are generally settled within the following financial year. The balance represents the appropriated amount receivable from the Crown at balance date. The Department has no reason to believe that the Crown will not fully settle the amount outstanding. Accordingly, no provision for impairment has been made.
Other revenue
Other revenue is recognised in the accounting period in which the service is provided.
Breakdown of Other Revenue
| 2023/24 Actual $000 |
2024/25 Actual $000 |
|
|---|---|---|
| 2,037 | Revenue Department - Other Government Agencies[12] | 2,001 |
| 220 | Third Party - Other Revenue | 429 |
| 2,257 | TOTAL OTHER REVENUE AND GAINS | 2,430 |
3. Personnel Costs
Accounting policy
Salaries and wages
Salaries and wages are recognised as an expense as employees provide services.
Superannuation schemes
Defined contribution schemes
Employee contributions to the State Sector Retirement Savings Scheme (“SSRSS”), KiwiSaver, and the Government Superannuation Fund (“GSF”) are accounted for as defined contribution superannuation schemes and are expensed in the surplus or deficit as incurred.
Defined benefit scheme
The Department makes contributions to the Defined Benefit Plan (DBP) Contributors Scheme (the scheme), which is managed by the Board of Trustees of the National Provident Fund. The scheme is a multi-employer defined benefit scheme.
Insufficient information is available to apply defined benefit accounting because the scheme's terms do not specify how any surplus or deficit will affect future contributions by individual employers, nor is there a prescribed basis for allocation. The scheme is therefore accounted for as a defined contribution scheme. Employer contributions to the defined benefit plans totalling $279,000 (2024: $396,000) have been classified as defined-contribution plan contributions. The expected contributions for the year ending 30 June 2026 are approximately $233,000.
Breakdown of Personnel Costs
| 2023/24 Actual $000 |
2024/25 Actual $000 |
|
|---|---|---|
| 63,362 | Salaries and Wages | 59,151 |
| 1,860 | Employer Contributions to Defined-Contribution Plans | 1,662 |
| 333 | Increase/(Decrease) in Employee Entitlements | (152) |
| - | Restructuring Costs | 1,077 |
| 1,060 | Other[13] | 987 |
| 66,615 | TOTAL PERSONNEL COSTS | 62,725 |
4. Capital Charge
Accounting policy
The capital charge is recognised as an expense in the financial year to which the charge relates.
The Department pays a capital charge to the Crown based on its equity as at 30 June and 31 December each year. The capital charge rate for the year ended 30 June 2025 was 5% (2024: 5%).
5. Other Operating Expenses
Accounting policy
Operating leases
An operating lease is a lease that does not transfer substantially all the risks and rewards incidental to ownership of an asset. Lease payments under an operating lease are recognised as an expense on a straight-line basis over the lease term. Lease incentives received are recognised in the surplus or deficit as a reduction of rental expense over the lease term.
Grant expenditure
The Department's grants awarded have no substantive conditions attached. Non-discretionary grants are those grants awarded if the grant application meets the specified criteria. They are recognised as an expense when an application that meets the specified criteria for the grant has been received.
Discretionary grants are those grants where the Department has no obligation to award on receipt of the grant application. They are recognised as an expense when approved by the Grants Approvals Committee and the approval has been communicated to the applicant.
Other expenses
Other expenses are recognised as goods and services are received.
Breakdown of Other Operating Expenses
| 2023/24 Actual $000 |
2024/25 Actual $000 |
|
|---|---|---|
| 12,550 | Central Agencies' Shared Services (finance, human resources and payroll, information technology, information management, web and publishing services) | 11,365 |
| 7,201 | Tsunami Monitoring and Detection Network Maintenance | 7,404 |
| 6,932 | Professional Services | 6,591 |
| 2,940 | Premises Rental | 3,462 |
| 603 | IT-related Costs | 2,313 |
| 1,980 | Travel Costs | 2,035 |
| 1,277 | Consultancy | 2,029 |
| 1,203 | Facilities Costs | 1,394 |
| 318 | Legal Fees | 1,211 |
| 1,180 | Promotion and Publicity Costs | 1,053 |
| 670 | Building and Ground Maintenance Costs | 764 |
| 611 | Grants & Sponsorship | 624 |
| 508 | Professional Development and Resources | 333 |
| 563 | Telecommunications | 327 |
| 201 | Photocopying and Printing Costs | 226 |
| 168 | Honours Insignia Costs | 164 |
| 159 | Fees for Audit of Financial Statements | 164 |
| 205 | Motor Vehicle Lease and Maintenance Expenses | 132 |
| 103 | Kitchen and Catering Expenses | 105 |
| 222 | Net (gain)/loss on Disposal of Property, Plant and Equipment | 21 |
| 804 | Other | 383 |
| 40,398 | TOTAL OTHER OPERATING EXPENSES | 42,100 |
6. Cash and Cash Equivalents
Accounting policy
Cash and cash equivalents include cash on hand, deposits held at call with banks. The Department is permitted to expend its cash and cash equivalents only within the scope and limits of its appropriations.
| 2023/24 Actual $000 |
2024/25 Actual $000 |
|
|---|---|---|
| 10,453 | Bank balances | 11,630 |
| 10,453 | TOTAL CASH AND CASH EQUIVALENTS | 11,630 |
7. Other Receivables
Accounting policy
Short-term receivables are recorded at the amount due, less an allowance for credit losses. The Department applies the simplified expected credit loss model of recognising lifetime expected credit losses for receivables.
In measuring expected credit losses, short-term receivables have been assessed on a collective basis as they possess shared credit risk characteristics. They have been grouped based on the days past due.
Short-term receivables are written off when there are no reasonable expectations of recovery. Indicators that there are no reasonable expectations of recovery include the debtor being in liquidation or the receivable being more than one year overdue.
Breakdown of Other Receivables
| 2023/24 Actual $000 |
2024/25 Actual $000 |
|
|---|---|---|
| 1,058 | Receivables from exchange transactions | 245 |
| 23 | Accrued receivables from exchange transactions | 158 |
| 1,081 | TOTAL RECEIVABLES | 403 |
| Receivables consist of | ||
| 1,017 | Cost recoveries from Government agencies | 400 |
| 64 | Other | 3 |
| 1,081 | TOTAL RECEIVABLES | 403 |
Ageing of Other Receivables
| 2023/24 Actual $000 |
2024/25 Actual $000 |
|
|---|---|---|
| 957 | Current | 233 |
| 61 | Past Due 31-60 days | 21 |
| 19 | Past Due 61-90 days | - |
| 44 | Past due 91 days not impaired[14] | 149 |
| 1,081 | TOTAL RECEIVABLES | 403 |
8. Property, Plant and Equipment
Accounting policy
Initial measurement
Items of property, plant and equipment are initially recognised at their cost. Cost includes expenditure that is directly attributable to the acquisition of the asset. Where an asset is acquired through a non-exchange transaction, it is recognised at fair value based on its estimated replacement cost at the acquisition date.
Subsequent costs
The cost of replacing part of an item of property, plant and equipment and on-going costs is recognised as an asset if, and only if, it is probable that future economic benefits or service potential will flow to the Department and the cost of the item can be measured reliably.
The costs of day-to-day servicing of property, plant, and equipment are recognised in surplus or deficit as they are incurred.
Disposals
When an item of property, plant or equipment is disposed of, the gain or loss recognised in the reported surplus or deficit is calculated as the difference between the net proceeds from disposal and the carrying amount of the asset.
Subsequent measurement
Items of property, plant and equipment are subsequently measured at cost, less accumulated depreciation and any impairment losses.
Depreciation
Depreciation is provided on a straight-line basis on all property, plant, and equipment at rates that will write off the cost of the assets to their estimated residual values over their useful lives.
The useful lives and associated depreciation rates of major classes of property, plant, and equipment have been estimated as follows:
- Fixtures 10 years
- Furniture 5 years
- Plant and Equipment 3 to 5 years
- Motor Vehicles 4 years
The residual value and useful life of an asset is reviewed, and adjusted if applicable, at each balance date.
Impairment
Property, plant and equipment are reviewed for impairment whenever events or changes in circumstances indicate that the carrying amount might not be recoverable. An impairment loss is recognised for the amount that the asset's carrying amount exceeds its recoverable service amount. The recoverable service amount is the higher of an asset's fair value less costs to sell and value in use.
Value in use is determined using a depreciated replacement cost approach.
If an asset's carrying amount exceeds its recoverable service amount, the asset is regarded as impaired and the carrying amount is written down to its recoverable amount. The total impairment loss is recognised in surplus or deficit. The reversal of an impairment loss is also recognised in surplus or deficit.
Breakdown of Property, Plant and Equipment Movements
| Furniture and Fittings $000 |
Motor Vehicles $000 |
Work in Progress $000 |
Plant and Equipment $000 |
Total PPE $000 |
|
|---|---|---|---|---|---|
| COST | |||||
| Balance at 1 July 2023 | 975 | 44 | 213 | 2,456 | 3,688 |
| Additions | - | - | 5,139 | - | 5,139 |
| Disposals | (420) | - | - | (532) | (952) |
| Transfers | 4,210 | - | (4,487) | 277 | - |
| BALANCE AT 30 JUNE 2024 | 4,765 | 44 | 865 | 2,201 | 7,875 |
| Additions | - | - | 350 | - | 350 |
| Disposals | (55) | - | - | (83) | (138) |
| Transfers | 96 | - | (1,136) | 1,040 | - |
| BALANCE AT 30 JUNE 2025 | 4,806 | 44 | 79 | 3,158 | 8,087 |
| ACCUMULATED DEPRECIATION AND IMPAIRMENT | |||||
| Balance at 1 July 2023 | 500 | 3 | - | 1,681 | 2,184 |
| Depreciation Expense | 138 | 15 | - | 269 | 422 |
| Disposals | (212) | - | - | (518) | (730) |
| BALANCE AT 30 JUNE 2024 | 426 | 18 | - | 1,432 | 1,876 |
| Depreciation Expense | 605 | 11 | - | 392 | 1,008 |
| Disposals | (34) | - | - | (83) | (117) |
| BALANCE AT 30 JUNE 2025 | 997 | 29 | - | 1,741 | 2,767 |
| CARRYING VALUE | |||||
| At 1 July 2023 | 475 | 41 | 213 | 775 | 1,504 |
| At 30 June 2024 | 4,339 | 26 | 865 | 769 | 5,999 |
| At 30 June 2025 | 3,809 | 15 | 79 | 1,417 | 5,320 |
9. Intangible assets
Accounting policy
Software acquisition and development
Acquired computer software licenses are capitalised on the basis of the costs incurred to acquire the specific software and bring it to use.
Costs that are directly associated with the development of software for internal use are recognised as an intangible asset. Direct costs include the costs of services, software development employee costs, and an appropriate portion of relevant overheads.
Staff training costs are recognised as an expense when incurred.
Costs associated with maintaining computer software are recognised as an expense when incurred.
Costs of software updates or upgrades are capitalised only when they increase the usefulness or value of the software.
Costs associated with development and maintenance of the Department's website are recognised as an expense when incurred.
Amortisation
The carrying value of an intangible asset with a finite life is amortised on a straight-line basis over its useful life. Amortisation begins when the asset is available for use and ceases at the date that the asset is derecognised. The amortisation charge is recognised in surplus or deficit for the year.
The useful lives and associated amortisation rates of major classes of intangible assets have been estimated as follows:
- Acquired computer software 5 years 20%
- Internally developed computer software 5 years 20%
The useful life of software is determined at the time the software is acquired and brought into use and is reviewed at each reporting date for appropriateness. For computer software licences, the useful life represents management's view of the expected period over which the Department will receive benefits from the software, but not exceeding the licence term. For internally generated software, the useful life is based on historical experience with similar systems as well as anticipation of future events that might affect the useful life, such as changes in technology.
Impairment
Intangible assets that have an indefinite useful life or that are not yet available for use are tested annually for impairment, irrespective of whether there is any indicator of impairment. For further details on the impairment approach refer to the policy in Property, Plant and Equipment (Note 8). The same approach applies to the impairment of intangible assets.
Breakdown of Intangible Assets Movements
Movements in the carrying value for each class of intangible asset are as follows:
| Acquired software $000 |
Internally developed software $000 |
Total $000 |
|
|---|---|---|---|
| COST | |||
| Balance at 1 July 2023 | 268 | 4,445 | 4,713 |
| Disposals | (21) | - | (21) |
| BALANCE AT 30 JUNE 2024 | 247 | 4,445 | 4,692 |
| BALANCE AT 30 JUNE 2025 | 247 | 4,445 | 4,692 |
| ACCUMULATED AMORTISATION AND IMPAIRMENT | |||
| Balance at 1 July 2023 | 239 | 4,445 | 4,684 |
| Amortisation Expense | 18 | - | 18 |
| Disposals | (21) | - | (21) |
| BALANCE AT 30 JUNE 2024 | 236 | 4,445 | 4,681 |
| Amortisation Expense | 11 | - | 11 |
| BALANCE AT 30 JUNE 2025 | 247 | 4,445 | 4,692 |
| CARRYING VALUE | |||
| At 1 July 2023 | 29 | - | 29 |
| At 30 June 2024 | 11 | - | 11 |
| At 30 June 2025 | - | - | - |
As at 30 June 2025, all intangible assets have been fully amortised.
10. Payables
Accounting policy
Short-term payables are recorded at the amount payable to suppliers.
Breakdown of payables
| 2023/24 Actual $000 |
2024/25 Actual $000 |
|
|---|---|---|
| PAYABLES – EXCHANGE TRANSACTIONS | ||
| 4,481 | Accrued Expenses | 4,787 |
| 2,372 | Payables | 3,724 |
| 6,853 | TOTAL PAYABLES (EXCHANGE) | 8,511 |
| PAYABLES – NON-EXCHANGE TRANSACTIONS | ||
| 4,128 | GST Payable | 1,637 |
| 4,128 | TOTAL PAYABLES (NON-EXCHANGE) | 1,637 |
| 10,981 | TOTAL PAYABLES | 10,148 |
11. Provision for Restructuring Costs
Accounting policy
The Department recognises a provision when there is a present obligation, either legal or constructive, as the result of a past event and it is probable that an outflow of resources will be required to settle the obligation, but the timing or the amount of the obligation is uncertain. The provision for restructuring costs is recognised when an approved, detailed, formal plan for a restructure has either been announced publicly to those affected or when implementation has already commenced. The restructuring provision includes only the direct expenditures arising from the restructuring, which are necessarily entailed by the restructuring and not associated with the ongoing activities of the entity.
On 15 May 2025, a proposed new structure for the Department was released to all staff for consultation. On 3 July 2025 the new structure was confirmed and communicated to all staff. This event is classified as an adjusting event and in accordance with applicable standards, the financial statements have been adjusted to reflect the financial impact of the restructure.
The provision covers employee termination benefits (e.g. redundancy payments) directly associated with the implementation of the restructuring. The provision does not include retraining or costs associated with future operations. All amounts are expected to be fully paid within 12 months of reporting date.
Movements in provision
| 2024/25 Actual $000 |
|
|---|---|
| Opening balance | - |
| Additional provision made during the year | 1,077 |
| CLOSING BALANCE | 1,077 |
12. Return of Operating Surplus
| 2023/24 Actual $000 |
2024/25 Actual $000 |
|
|---|---|---|
| 22,368 | Return of operating surplus | 10,826 |
The return of operating surplus to the Crown is required to be paid by 31 October of each year.
13. Employee Entitlements
Accounting policy
Accrued salaries, annual leave, retirement leave, and other employee entitlements expected to be settled within 12 months of balance date are measured based on accrued entitlements at current rates of pay and are classified as current liabilities. All other employee entitlements are classified as non-current liabilities.
Employee entitlements that are not expected to be settled wholly before 12 months after the end of the reporting period that the employees provide the related service in, such as long service leave and retirement gratuities, have been calculated on an actuarial basis. The calculations are based on:
- likely future entitlements accruing to employees, based on years of service, years to entitlement, the likelihood that employees will reach the point of entitlement, and contractual entitlements information, and
- the present value of the estimated future cash flows.
Presentation of employee entitlements
Sick leave, annual leave, vested long service leave, and non-vested long service leave expected to be settled within 12 months of balance date are classified as a current liability. All other employee entitlements are classified as a non-current liability.
Critical accounting estimates and assumptions
The present value of the retirement and long service leave obligations depends on a number of factors. Two key factors are the discount rate and the salary-inflation factor:
| 5.30% | Year 1 | 3.14% |
| 4.49% | Year 2 | 3.47% |
| 5.11% | Year 3 | 5.58% |
| 3.80% | Year 1 | 2.60% |
| 3.10% | Year 2 | 2.89% |
| 3.00% | Year 3 | 2.89% |
Any changes in these assumptions will change the carrying amount of the liability.
In determining the appropriate discount rate, the Department has adopted the table of risk-free discount rates and consumers price index assumptions provided by the Treasury to all departments.
Breakdown of employee entitlements
| 2023/24 Actual $000 |
2024/25 Actual $000 |
|
|---|---|---|
| CURRENT | ||
| 3,384 | Annual Leave | 2,882 |
| 1,509 | Salary Accrual | 1,957 |
| 208 | Long Service Leave | 179 |
| 112 | Other Employee Benefits | 47 |
| 140 | Sick Leave | 153 |
| 5,353 | TOTAL CURRENT LIABILITIES | 5,218 |
| NON-CURRENT | ||
| 284 | Long Service Leave | 267 |
| 284 | TOTAL NON-CURRENT LIABILITIES | 267 |
| 5,637 | TOTAL EMPLOYEE ENTITLEMENTS | 5,485 |
14. Reconciliation of Net Surplus to Net Cash Flows from Operating Activities
| 2023/24 Actual $000 |
2024/25 Actual $000 |
|
|---|---|---|
| 22,368 | NET SURPLUS (DEFICIT) | 10,826 |
| ADD/(LESS) NON-CASH ITEMS | ||
| 440 | Depreciation and Amortisation | 1,019 |
| 440 | TOTAL NON-CASH ITEMS | 1,019 |
| ADD/(LESS) WORKING CAPITAL MOVEMENT | ||
| 27,520 | (Increase)/Decrease in Receivables and Prepayments | 11,898 |
| (21) | (Increase)/Decrease in Inventories | 39 |
| (4,835) | Increase/(Decrease) in Payables | 1,658 |
| (3,087) | Increase/(Decrease) in GST | (2,491) |
| - | Increase/(Decrease) in Provisions | 1,077 |
| (362) | Increase/(Decrease) in Employee Entitlements | (135) |
| 19,215 | TOTAL NET MOVEMENT IN WORKING CAPITAL ITEMS | 12,046 |
| (98) | Add/(Less) Movements in Non-current Liabilities | (17) |
| ADD/(LESS) ITEMS CLASSIFIED AS INVESTING OR FINANCING ACTIVITIES | ||
| 222 | (Gain)/loss on disposal of property, plant, and equipment | 21 |
| 42,147 | NET CASH FLOWS FROM OPERATING ACTIVITIES | 23,895 |
15. Financial Instruments
Classification of financial instruments
For financial reporting purposes all financial assets and financial liabilities are classified as being measured at amortised cost.
Based on the nature of financial instruments held, the Department has no financial instruments measured at fair value as at 30 June 2025 (2024: Nil).
Financial instrument risks
The Department's activities expose it to a variety of financial instrument risks, including currency risk, credit risk, and liquidity risk. The Department has policies to manage the risks associated with financial instruments and seeks to minimise exposure from financial instruments. These policies do not allow it to enter into any transactions that are speculative in nature.
Currency risk
Currency risk is the risk that the fair value or future cash flows of a financial instrument will fluctuate due to changes in foreign exchange rates. Currency risk arises from future purchases and recognised liabilities that are denominated in a foreign currency.
The Department may contract for services internationally, but has limited exposure to currency risk because such transactions are concluded within a short period.
Credit risk
Credit risk is the risk that a third party will default on its obligation, causing the Department to incur a loss.
In the normal course of its business, credit risk arises from receivables and deposits with banks.
The Department's maximum credit exposure for each class of financial instrument is represented by the total carrying amount of cash and cash equivalents and receivables.
The Department is permitted to deposit funds only with Westpac (Standard & Poor's credit rating of AA-), a registered bank, and enter into foreign exchange forward contracts with the New Zealand Debt Management function within Treasury (Standard & Poor's credit rating of AA). The credit risk of cash and cash equivalents is therefore considered trivial.
The credit risk in regard to receivable balances is considered low because the Department transacts with counterparties that have a strong credit history, primarily government departments, and forward-looking information does not suggest a deterioration in their ability to meet obligations.
Liquidity risk
Liquidity risk is the risk that the Department will encounter difficulty raising liquid funds to meet its commitments as they fall due. As part of meeting its liquidity requirements, the Department closely monitors its forecast cash requirements with expected cash drawdowns from the New Zealand Debt Management function within Treasury. The Department maintains a target level of available cash to meet liquidity requirements.
The only form of financial instrument liabilities held by the Department are payables which are generally payable in less than 30 days.
16. Related-party Transactions
Related parties exist when an entity or person(s) has the ability to significantly influence the financial and operating policies of the Department. The Department has a related party relationship with the Crown, and key management personnel.
The Department is a wholly owned entity of the Crown.
The Department undertakes transactions with other departments, Crown entities and State-Owned Enterprises (SOEs). These transactions are carried out at an arm's length basis and are therefore not disclosed as related-party transactions except for rent for part of the Department located in the Executive Wing of Parliament Buildings where no rental is being incurred. Apart from those transactions, the Department has not entered into any related-party transactions.
In conducting its activities, the Department is required to pay various taxes and levies to the Crown and entities related to the Crown. The payment of these taxes and levies is based on the standard terms and conditions that apply to all tax and levy payers. The Department is exempt from paying income tax.
There were no related-party transactions involving key management personnel or their close family members. No provision has been required, nor any expense recognised, for impairment of receivables from related parties (2024: Nil).
Key management personnel compensation
Key management personnel includes the Department's Executive Leadership Team, including the Chief Executive.
| 2023/24 Actual $000 |
2024/25 Actual $000 |
|
|---|---|---|
| 3,286 | Total key management personnel remuneration | 3,153 |
| 9 | Number of persons recognised as key management personnel (determined on an FTE basis) | 8 |
The above key management personnel compensation excludes the remuneration and other benefits for the Prime Minister and other Cabinet Ministers. The Ministers' remuneration and other benefits are set by the Remuneration Authority under the Members of Parliament (Remuneration and Services) Act 2013 and are paid under Permanent Legislative Authority, not by the Department.
17. Explanations of Major Variances Against Budget
Explanations for major variances between the Department's original 2024/25 budget figures and the 2024/25 year actuals are as follows:
Revenue
Revenue was higher than budgeted by $4.521 million due to decisions made since the 2024/25 initial Budget.
These mainly relate to:
- increased funding due to transfers from the prior year for supporting the Government response to the 2023 North Island severe weather events, tsunami monitoring and detection network, Royal Commission of Inquiry into the terrorist attack on Christchurch mosques, cyber security activities, Whakaari/White Island Coronial Inquiry, Emergency Mobile Alerting plus other minor transfers ($14.366 million)
- contributions from other Departments including contributions to the Policy Project, Pacific Partnership Programme and other items ($2.406 million)
- transfer of appropriation for Buller Flood Recovery from Non-departmental ($2.100 million)
- transfer of appropriations from other departments ($400,000), and
- other third-party income including an insurance settlement, rental from Government House residential properties and travel rebates ($186,000).
This was offset by the following:
- transfer of funding to 2025/26 for delayed initiatives and programmes, and to mitigate future cost pressures on DPMC ($12.955 million)
- transfer of funding to Vote Internal Affairs for the Government response to extreme weather events ($1.500 million), and
- lower than expected contributions from other agencies for Pacific resilience and other minor third-party income ($473,000)
Expenditure
Expenditure was lower than budgeted by $6.305 million mainly due to:
- national security, risk and resilience functions ($4.269 million), and
- 2023 North Island severe weather events support administration ($6.577 million).
Offsetting the lower expenditure was higher expenditure relating to funding approved since Budget 2024, including:
- support and maintenance of the tsunami monitoring and detection network ($2.326 million)
- Ministry of Foreign Affairs and Trade Pacific Partnership programme ($0.522 million)
- emergency mobile alerting ($0.540 million), and
- Government House operating costs ($0.331 million).
Balance sheet
Total assets exceeded the 2024/25 Budget by $3.694 million due to larger cash and debtor Crown balances than expected, as operating expenditure was lower than anticipated in the 2024/25 Supplementary Estimates of Appropriations.
This was offset by total liabilities exceeding 2024/25 budget by $3.787 million, reflecting a provision for repayment of the operating surplus ($10.826 million), higher employee entitlements provision than assumed in the initial budget ($1.788 million) and lower accounts payable than assumed by the budget ($8.827 million).
Cash flow
Receipts from the Crown exceeded budget by $3.186 million due to additional funding for activities transferred from 2023/24, and increases approved through the 2024/25 Supplementary Estimates of Appropriations. Payments to suppliers were lower than budgeted in line with the lower than budgeted total expenditure.
This was offset by repayment of the previous year's surplus ($9.954 million higher than budget) and net GST recovered was higher than assumed in the initial budget. Receipts from other departments were lower than expected.
18. Events After the Balance Date
The responsibility for hosting the departmental agency, the National Emergency Management Agency, transferred from the Department of the Prime Minister and Cabinet to the Department of Internal Affairs on 25 September 2025 (see Note 1 for further details).
Subsequent to balance date, on 3 July 2025 a proposed new structure for the Department was confirmed and communicated to all staff. This event is classified as an adjusting event and the financial statements have been adjusted to reflect the financial impact of the restructure (see Note 11).
Non-departmental financial schedules#
Schedule of Non-departmental Expenses
for the year ended 30 June 2025
The Schedule of Expenses summarises expenses that the Department administers on behalf of the Crown.
| 2023/24 Actual $000 |
Note | 2024/25 Actual $000 |
2024/25 Unaudited Budget $000 |
|
|---|---|---|---|---|
| 823,480 | Grants and Contributions | 3 | 1,000,920 | 188,106 |
| 17,810 | Increase/(Decrease) to Provisions for emergency events | 7 | (4,165) | - |
| 3,141 | Depreciation | 2 | 3,203 | 3,489 |
| 4,740 | Other Operating Costs | 4 | 6,033 | 5,961 |
| 49,163 | Goods and Services Tax | 124,540 | 72,603 | |
| 898,334 | TOTAL NON-DEPARTMENTAL EXPENSES | 1,130,531 | 270,159 |
Schedule of Non-departmental Revenue and Receipts
for the year ended 30 June 2025
| 2023/24 Actual $000 |
2024/25 Actual $000 |
2024/25 Unaudited Budget $000 |
|
|---|---|---|---|
| 6,125 | Other Revenue | 3,520 | 4,050 |
| 6,125 | TOTAL NON-DEPARTMENTAL REVENUE AND RECEIPTS | 3,520 | 4,050 |
Schedule of Non-departmental Assets and Liabilities
as at 30 June 2025
| 2023/24 Actual $000 (Restated*) |
Note | 2024/25 Actual $000 |
2024/25 Unaudited Budget $000 |
|
|---|---|---|---|---|
| ASSETS | ||||
| CURRENT ASSETS | ||||
| 9,000 | Cash in Bank | 23,836 | 27,767 | |
| 60,230 | Funds held by Programme Administrator | 5 | 254,775 | - |
| 21 | Receivables | 1,971 | 1,020 | |
| - | Prepayment | 6 | 11,662 | - |
| 69,251 | TOTAL CURRENT ASSETS | 292,244 | 28,787 | |
| NON-CURRENT ASSETS | ||||
| 165,360 | Property, Plant and Equipment | 2 | 207,712 | 161,600 |
| 165,360 | TOTAL NON-CURRENT ASSETS | 207,712 | 161,600 | |
| 234,611 | TOTAL NON-DEPARTMENTAL ASSETS | 499,956 | 190,387 | |
| LIABILITIES | ||||
| CURRENT LIABILITIES | ||||
| 8,712 | Payables | 1,392 | 1,700 | |
| 559,960 | Provisions | 7 | 700,196 | 54,508 |
| 568,672 | TOTAL CURRENT LIABILITIES | 701,588 | 56,208 | |
| NON-CURRENT LIABILITIES | ||||
| 87,431 | Provisions | 7 | 324,158 | - |
| 87,431 | TOTAL NON-CURRENT LIABILITIES | 324,158 | - | |
| 656,103 | TOTAL LIABILITIES | 1,025,746 | 56,208 | |
| REVALUATION RESERVES | ||||
| 86,901 | Property Revaluation Reserves | 2 | 132,108 | 86,652 |
| 86,901 | TOTAL REVALUATION RESERVES | 132,108 | 86,652 |
* The 2023/24 actual amounts have been restated to reflect a classification amendment between assets and liabilities - for further information refer to Note 8.
Schedule of Non-departmental Commitments
as at 30 June 2025
As at 30 June 2025, there are no operating commitments in Vote Prime Minister and Cabinet (2024: Nil).
As at 30 June 2025, there are no capital commitments in Vote Prime Minister and Cabinet (2024: Nil).
Schedule of Non-departmental Contingent Liabilities and Contingent Assets
as at 30 June 2025
Vote Prime Minister and Cabinet, on behalf of the Crown, has the following contingent liabilities and assets as at 30 June 2025:
Contingent liabilities - quantifiable
As at 30 June 2025, there are no quantifiable contingent liabilities (2024: Nil).
Contingent assets - quantifiable
As at 30 June 2025, there are no quantifiable contingent assets (2024: Nil).
Contingent liabilities - unquantifiable
New Zealand Local Authorities
Section 39 of the Civil Defence Emergency Management Act 2002 provides for a National Civil Defence Emergency Management Plan (the National CDEM Plan). The National CDEM Plan sets out the principles of government financial support to local authorities, and its accompanying Guide sets out the criteria and arrangements for this support as set by Government policy for costs incurred as a result of a local or national emergency.
As at 30 June 2025, there were 10 events (2024: 9) from which we expect to receive claims for reimbursement from local authorities for welfare, response and recovery costs. A provision of $33.942 million has been made for costs that have been quantified for these and other emergency events (see Note 7) (2024: $49.326 million).
The most significant emergency events for which an unquantified contingent liability exists are the 2021 and 2022 flooding events that impacted the West Coast and Nelson, the Auckland weather events in April 2025 and June 2025 and the Nelson-Tasman weather events in June 2025 and July 2025. As at 30 June 2025, the size of these potential claims were unable to be quantified due to a lack of knowledge or basis on which to make any precise expense estimation. Local authorities need time to assess the extent of the damages and repair costs.
The accompanying notes and policies form part of these Financial Statements.
Notes to the Non-departmental financial schedules#
1. Statement of accounting policies
Reporting entity
These non-departmental schedules present financial information on public funds that the Department manages on behalf of the Crown.
These non-departmental balances are consolidated into the Financial Statements of the Government for the year ended 30 June 2025. For a full understanding of the Crown's financial position, results of operations, and cash flows for the year, refer to the Financial Statements of the Government for the year ended 30 June 2025.
Basis of preparation
The non-departmental schedules have been prepared in accordance with the accounting policies of the consolidated Financial Statements of the Government, Treasury Instructions, and Treasury Circulars.
Measurement and recognition rules applied in the preparation of these non-departmental statements and schedules are consistent with generally accepted accounting practice (Public Benefit Entity Accounting Standards) as appropriate for public benefit entities.
Goods and services tax
Items in the non-departmental statements and schedules are stated exclusive of GST, except for receivables and payables, which are stated on a GST-inclusive basis. GST is returned on revenue received on behalf of the Crown, where applicable. However, an input tax deduction is not claimed on non-departmental expenditure. Instead, the amount of GST applicable to non-departmental expenditure is recognised as a separate expense in the schedule of non-departmental expenses, and is eliminated against GST revenue on consolidation of the Financial Statements of the Government.
Presentation currency and rounding
The non-departmental schedules are presented in New Zealand dollars (NZ dollars), and all values are rounded to the nearest thousand dollars ($000).
Other changes in accounting policies
There have been no changes in the Crown's accounting policies impacting the presentation of the non-departmental schedules and accompanying notes since the date of the last audited financial statements.
Critical accounting estimates and assumptions
In preparing these non-departmental schedules, estimates and assumptions have been made concerning the future. These estimates and assumptions may differ from the subsequent actual results. Estimates and assumptions are continually evaluated and are based on historical experience and other factors, including expectations of future events that are believed to be reasonable under the circumstances.
The estimates and assumptions that have a significant risk of causing a material adjustment to the carrying amounts of the non-departmental assets and liabilities within the next reporting period are in respect of estimating the fair value of land and buildings (see Note 2 Property, Plant and Equipment) and the non-departmental provisions for emergencies (see Note 7 Provisions).
Summary of significant accounting policies
Significant accounting policies are included in the notes to which they relate. Significant accounting policies that do not relate to a specific note are outlined below:
Donated assets
Where a physical asset is acquired for nil or nominal consideration, the fair value of the asset received is recognised as revenue in the Schedule of Non-departmental Revenue and Receipts if it meets the capitalisation value threshold.
Explanatory notes provide details of significant Vote Prime Minister and Cabinet non-departmental expenditure, revenue, assets and liabilities. All non-departmental balances are included in the Financial Statements of the Government of New Zealand.
Comparatives
When a presentation or classification of an item in the non-departmental financial schedules is amended or an accounting policy is changed voluntarily, comparative figures are restated to ensure consistency with the current period unless it is impracticable to do so.
The comparative financial period presented is 12 months. All comparative information is consistent with the previous year, except for the reclassification amendment as explained in Note 8.
2. Property, Plant and Equipment #
Accounting policy
Property, plant, and equipment consists of the following asset classes: land, buildings, antiques and artworks, and plant and equipment.
Land is measured at fair value, and buildings are measured at fair value less accumulated depreciation and impairment losses. Antiques and artworks are held at fair value. All other assets classes are measured at cost, less accumulated depreciation, and impairment losses.
Revaluations
Land and buildings are revalued, at least every three years, to ensure that the carrying amount does not differ materially from the fair value and at least every three years.
When measuring the fair value of revalued assets, the Department uses observable market data as far as possible or depreciated replacement cost.
The carrying values of revalued assets are assessed annually to ensure that they do not differ materially from fair value. If there is a material difference, then the asset classes are revalued.
Land and building revaluation movements are accounted for on a class-of-asset basis.
The net revaluation results are credited or debited to other comprehensive revenue and expense, and are accumulated to an asset revaluation reserve in equity for that class of asset. Where this would result in a debit balance in the asset revaluation reserve, this balance is not recognised in other comprehensive revenue and expense, but is recognised in surplus or deficit. Any subsequent increase on revaluation that reverses a previous decrease in value recognised in surplus or deficit will be recognised first in surplus or deficit up to the amount previously expensed, then recognised in other comprehensive revenue and expense.
Depreciation
Depreciation is provided on a straight-line basis to allocate cost or revalued amounts, net of any estimated residual value, over the estimated useful life. Antiques and artworks are not depreciated. The useful lives of other major classes of assets have been estimated as follows:
| Type of Asset | Estimated Life (years) |
|---|---|
| Buildings | 50-120 years |
| Plant and Equipment | 3-51 years |
| All Other Assets | 3-100 years |
Critical accounting estimates and assumptions
Estimating the fair value of land and buildings
Land
Government House land and buildings in Auckland and Wellington are revalued every two years. They were revalued to fair values as at 30 June 2025 by independent registered valuers, William Liew and David Cornford of Quotable Value Limited (“QV”). The valuation undertaken by QV was completed in accordance with PBE IPSAS 17 Property, Plant and Equipment, New Zealand Institute of Valuers, Property Institute of New Zealand Code of Ethics, and in accordance with International Valuation Standards effective 31 January 2025 and Guidance Papers for Valuers and Property Professionals effective 1 July 2021.
QV has applied the Comparable Transactions Method (CTM) for the land valuation. Under this method, the subject property is valued by reference to recent arm's length transactions for comparable sites, with appropriate adjustments made to reflect differences in key attributes such as location, zoning, size, topography, access, development potential, and market conditions. CTM was assessed as appropriate for several reasons:
- Active Market Evidence: There was sufficient availability of recent sales transactions for large residential development sites within the Wellington and Auckland regions, allowing for meaningful comparisons to be made. This reduces the reliance on subjective forecasts or models and better reflects current market conditions. The valuer can directly observe market participant behaviour, rather than relying on hypothetical or modelling assumptions.
- Market Participant Perspective: PBE IPSAS 17 requires that fair value reflects the price that would be received in an orderly transaction between market participants at the measurement date. The use of actual market transactions provides observable evidence of the pricing behaviour of market participants.
- Hypothetical Subdivision Method: this method is a specialised application of the CTM, which estimates the gross realisable value of subdivided lots based on observed sales of comparable developed lots. This method reflects the approach that market participants would adopt in valuing individual lots of land where subdivision has not yet occurred. Prospective developers typically assess the expected selling price of individual lots, deduct development costs, and adjust for profit, risk, and timing to arrive at the underlying land value. The approach is well-established in development land valuation practice, as it captures both current market evidence and development feasibility, while grounding key inputs such as selling prices in observable sales data.
- Alignment with Valuation Standards: The method is consistent with valuation guidance provided by the International Valuation Standards (IVS), which recognise the comparable sales approach as the preferred method where reliable market data exists.
The key driver of the significant uplift in land value for Wellington is the full rezoning of the site to High Density Residential as at 30 June 2025. This represents a significant change from the prior year's valuation, where only 1.15 ha of the total 12.428 ha site was previously zoned for residential use. The zoning change materially enhances the site's highest and best use, enabling full-scale residential development potential across the entire property. The valuation reflects both physical site characteristics and the expanded planning-based development potential introduced by the new zoning.
The uplift in land value for Auckland aligns with available market data, including recent listings and sales data from realestate.co.nz. The valuation also takes into account 21,020 sqm of useable land (development land) where development feasibility is central to market value and 18,897 sqm of ecological land (non-developable land) where the value lies in their amenity value rather than development potential.
Government House, Wellington, has been classified as being of national significance. This has been taken into account in the valuation of the property. Government House, Auckland, has a restrictive interest issued on the title of the property. For the purposes of the valuation, it is made subject to the property being free of detrimental interest/encumbrances with the property having freely transferrable titles.
Buildings
Non-specialised buildings are valued at fair value using market- based evidence using the Direct Sales Comparison Method. The Direct Sales Comparison Method is based on comparison of the subject asset to other similar assets that have recently sold. Adjustments are made to allow for factors such as age of sale, size, location, quality, condition, marketability, age, shape of site, access, contour, aspect and tenure.
Specialised buildings are valued at fair value using depreciated replacement cost because no reliable market data is available for such buildings.
Depreciated replacement cost is determined using several significant assumptions. Significant assumptions used in the 30 June 2025 valuation include:
- The replacement costs of the specific assets are adjusted where appropriate for optimisation due to over-design or surplus capacity. There have been no optimisation adjustments for the most recent valuations.
- The replacement cost rates are derived from construction contracts of like assets, reference to publications such as the QV Costbuilder (formerly Rawlinsons Construction Handbook), recent costings obtained from construction details and New Zealand Property Institute cost information.
- Current supply chain issues and market conditions are impacting replacement costs in the depreciated replacement cost calculations. On advice from the valuer, our judgment is that these resulting cost increases will be sustained over the long term rather than short-term fluctuations. Therefore, recent cost increases have been taken into account in determining depreciated replacement cost.
- There are no significant asbestos issues associated with the buildings.
- The remaining useful life of assets is estimated after considering factors such as the condition of the asset, future maintenance and replacement plans, and experience with similar buildings.
- Straight-line depreciation has been applied in determining the depreciated replacement cost value of the asset.
Antiques and artworks
Antiques and artworks are revalued every three years. The collection of antiques and artwork was revalued to fair values as at 30 June 2024 by an independent registered valuer, James Parkinson of Dunbar Sloane Limited.
When ascribing values to items, consideration was given to:
- Market based evidence as adjudged by Dunbar Sloane as active and knowledgeable participants in the market.
- Historical significance, recognising that there is a strong trend in sales results that reflect that significance.
- Comparisons with the values ascribed to similar items held in other institutions including the National Museum, Te Papa Tongarewa collection.
- Recent auction catalogued sales and online sales both nationally and internationally.
- Online International art data bases, including Artnet.
- Current market evidence and trends.
Breakdown of property, plant, and equipment and further information
Movements for each class of property, plant, and equipment are as follows:
| Land $000 |
Buildings $000 |
Antiques and Artworks $000 |
Plant and Equipment $000 |
Work in Progress $000 |
Other Assets $000 |
Total $000 |
|
|---|---|---|---|---|---|---|---|
| COST | |||||||
| BALANCE AT 30 JUNE 2023 | 81,548 | 64,971 | 4,444 | 21,917 | 311 | 1,940 | 175,131 |
| Additions | - | - | - | - | 858 | - | 858 |
| Transfers | - | 177 | 10 | 70 | (529) | 272 | - |
| Other Movements | - | (1) | - | - | - | - | (1) |
| Revaluation | - | - | 243 | - | - | - | 243 |
| BALANCE AT 30 JUNE 2024 | 81,548 | 65,147 | 4,697 | 21,987 | 640 | 2,212 | 176,231 |
| Additions | - | - | - | - | 346 | - | 346 |
| Transfers | - | - | - | 309 | (840) | 531 | - |
| Other Movements | - | - | - | 2 | - | - | 2 |
| Revaluation | 43,050 | 460 | 5 | - | - | - | 43,515 |
| BALANCE AT 30 JUNE 2025 | 124,598 | 65,607 | 4,702 | 22,298 | 146 | 2,743 | 220,094 |
| ACCUMULATED DEPRECIATION AND IMPAIRMENT LOSSES | |||||||
| BALANCE AT 1 JULY 2023 | - | - | - | 6,292 | - | 1,444 | 7,736 |
| Depreciation Expense | - | 846 | - | 2,185 | - | 110 | 3,141 |
| Disposals | - | - | - | - | - | (6) | (6) |
| BALANCE AT 30 JUNE 2024 | - | 846 | - | 8,477 | - | 1,548 | 10,871 |
| Depreciation Expense | - | 846 | - | 2,207 | - | 150 | 3,203 |
| Revaluation Write Back | - | (1,692) | - | - | - | - | (1,692) |
| BALANCE AT 30 JUNE 2025 | - | - | - | 10,684 | - | 1,698 | 12,382 |
| CARRYING VALUE | |||||||
| At 1 July 2023 | 81,548 | 64,971 | 4,444 | 15,625 | 311 | 496 | 167,395 |
| At 30 June 2024 | 81,548 | 64,301 | 4,697 | 13,510 | 640 | 664 | 165,360 |
| At 30 June 2025 | 124,598 | 65,607 | 4,702 | 11,614 | 146 | 1,045 | 207,712 |
3. Grants and Contributions#
| 2023/24 Actual $000 |
2024/25 Actual $000 |
|
|---|---|---|
| 807,087 | Grants for North Island Severe Weather Events | 982,527 |
| 10,582 | Grants for Emergency Events | 14,267 |
| 5,811 | Other Grants | 4,126 |
| 823,480 | TOTAL | 1,000,920 |
4. Other Operating Expenses#
Breakdown of other operating expenses is as follows:
| 2023/24 Actual $000 |
2024/25 Actual $000 |
|
|---|---|---|
| 1,190 | Personnel Costs | 1,023 |
| 1,110 | Consultancy | 2,609 |
| 920 | Building and Equipment Maintenance Costs | 909 |
| 540 | Travel Costs | 526 |
| 751 | Ceremonial and Catering Costs | 830 |
| 229 | Other Operating Expenses | 136 |
| 4,740 | TOTAL OTHER OPERATING EXPENSES | 6,033 |
5. Funds Held By Programme Administrator#
Funds held by National Infrastructure Funding and Financing Limited (NIFFCo) for distribution pertain to funding provided to the company to deliver financial support to local authorities impacted by severe weather events under the Cyclone Recovery programme. NIFFCo has been determined to be acting as an agent of the Crown for the programme with relation to the distribution of funding grants. In reaching this judgement, the following key factors have been considered:
- NIFFCo's role is to manage and administer the programme and arrange for funding to be transferred to recipients on satisfaction of terms of the funding agreements.
- NIFFCo does not have significant discretion in respect to which recipients are funded, or how much they receive.
- NIFFCo received a fixed administration fee rather than margin-based income.
Breakdown of funds held by NIFFCo is as follows:
| 2023/24 Actual $000 |
2024/25 Actual $000 |
|
|---|---|---|
| 40,508 | FOSAL - Category 2 | 68,075 |
| 10,509 | FOSAL - Category 3 | 56,132 |
| 9,022 | Flood Resilience | 33,747 |
| 191 | Kaupapa Māori Pathway | 96,821 |
| 60,230 | TOTAL | 254,775 |
* Refer to Prior Period Restatement Note 8.
6. Prepayment #
A prepayment of $11.662 million was made to NIFFCo as a contingency amount for the Future of Severely Affected Land (FOSAL) programme.
7. Provisions#
Accounting policy
A provision is recognised for future expenditure of uncertain amount or timing when:
- there is a present obligation (either legal or constructive) as a result of a past event
- it is probable that an outflow of resources embodying economic benefits or service potential will be required to settle the obligation, and
- a reliable estimate can be made of the amount of the obligation.
Provisions are not recognised for net deficits from future operating activities.
Provisions are measured at the present value of the expenditure expected to be required to settle the obligation. Where the effect of time value of money is material, a pre-tax discount rate based on market yields on government bonds at balance date with terms to maturity that match, as closely as possible, is used to estimate present value of the future cash outflows. Any increase in the provision due to the passage of time is recognised as an interest expense and is included in other operating expenses.
| Emergency Expensesa $000 |
Future of Severely |
Total Provisions $000 |
||||
|---|---|---|---|---|---|---|
| Flood Resilience | Category 2 | Category 3 | Kaupapa Māori Pathway |
|||
| Balance at 1 July 2024 | ||||||
| As previously reported | 49,326 | - | 147,425 | 390,410 | - | 587,161 |
| Amendment (Refer to Note 8) | - | 9,022 | 40,508 | 10,509 | 191 | 60,230 |
| Restated balance | 49,326 | 9,022 | 187,933 | 400,919 | 191 | 647,391 |
| Discount to reflect present value | - | - | (32,089) | - | - | (32,089) |
| Additional provision made during the year | - | 39,669 | 673,642 | 165,797 | 110,228 | 989,336 |
| Changes to provision - previous events | (4,165) | - | - | - | - | (4,165) |
| Payments made during the year/Provision used for the year | (11,219) | (14,837) | (148,021) | (388,444) | (13,598) | (576,119) |
| Balance at 30 June 2025 | 33,942 | 33,854 | 681,465 | 178,272 | 96,821 | 1,024,354 |
| 30 June 2025 | ||||||
| Current | 33,942 | 33,854 | 357,307 | 178,272 | 96,821 | 700,196 |
| Non-current | - | - | 324,158 | - | - | 324,158 |
| TOTAL PROVISION | 33,942 | 33,854 | 681,465 | 178,272 | 96,821 | 1,024,354 |
Following the disestablishment of the Chief Executive Cyclone Recovery, hosted by the Department, the provisions for Emergency Expenses and FOSAL were transferred to the Departmental of Internal Affairs on 25 September 2025.
As the provisions are reported in the non-departmental schedules, the current/non-current split has been determined based on when the Crown expects the funding obligations to be satisfied.
When significant emergency events occur, the Crown may provide financial support to local authorities for response and recovery costs relating to damaged essential infrastructure. The National Civil Defence Emergency Management (CDEM) Plan Order 2015 stipulates how the Crown may contribute to these costs. The Crown's contribution to response and recovery costs, most notably for wastewater, stormwater and potable water infrastructure is typically 60% of the total cost for valid and eligible work.
a. Emergency Expenses provision
The Emergency Expenses provision records the estimated cost of likely claims from local authorities for the Crown's reimbursement to local authorities for the cost of repairs following an emergency event and other eligible costs as set out in the National CDEM Plan.
The Emergency Expenses provision comprises:
- $4.398 million for Marlborough/Nelson Flooding in August 2022
- $21.270 million for the North Island Severe Weather Events in January/February 2023
- $6.746 million for Marlborough flooding in July 2021
- $1.528 million for the cost of the Crown's contribution to support the Buller District Council in repairs associated with flooding events of July 2021 and February 2022.
These estimates are based on information provided from the relevant local authorities.
b. Future of Severely Affected Locations Category 2 and 3 (FOSAL)
A number of factors generate uncertainties when estimating the timing and amounts of the future cost commitments. The present value of the expected liability has been calculated using several key assumptions, including management's best estimate of when the associated obligations are expected to be settled and the applicable discount rate. The discount rates applied are the official risk-free rates sourced from the Treasury website, which reflect the time value of money.
The provision reflects the agreed maximum obligation for Crown contributions to Local Authorities for voluntary property buyouts and flood remediation or resilience projects. Amounts are recognised upon receiving Ministerial approval for projects, and the provision is reduced as the agreed funding is disbursed to the ultimate beneficiary local authorities. If the combination of the number of properties ultimately assessed as qualifying for inclusion within the programme is lower than used in the negotiation, or the valuations are lower than estimated, or the take-up rate of offers is lower than estimated, or insurance proceed offsets are higher than estimated, the provision will be reduced to reflect the revised estimate. If the estimated cost of the programme, when assessments are completed, exceeds the amounts used in establishing the funding agreements, no increase to the provision will be made unless the maximum obligation set in the applicable funding agreement is renegotiated. Similarly, any transfers between categories of the funding agreements require Ministerial approval. The Risk Mitigation and Transport projects provision is the estimated contribution towards approved projects. The timing and final costs incurred for these projects will impact on the use of the provision.
From 1 July 2025, the administration of the FOSAL programme was transferred to the Department of Internal Affairs (DIA). Accordingly, this provision was transferred to DIA's non-departmental schedules as of that date.
8. Prior Period Restatement#
The prior period restatement relates to the balance of $60,230 thousand paid by the Department to NIFFCo as at 30 June 2024 to support funding of FOSAL projects, which was pending transfer to local authorities. This transfer of funds to NIFFCo was previously accounted for as reduction to the FOSAL Provision (Note 7).
The prior period restatement relates to a reclassification between the non-departmental assets and liabilities for the year ended 30 June 2024. The restatement had no impact on the previously reported non-departmental revenue and expenses.
In the current year, the funding paid to NIFFCo to support funding of FOSAL projects, which is pending transfer to local authorities has been treated as a separate asset balance (akin to a prepayment), rather than decreasing the FOSAL provision. This approach has been taken in recognition that the obligations arising from the FOSAL provision are not considered to have been fully satisfied until the funding has been ultimately transferred to the local authorities. The restatement has been made to ensure a consistent classification approach has been taken for both 2024 and 2025. The impact of the restatement is presented below:
| Schedule of Non-departmental Assets and liabilities 30 June 2024 |
As previously reported $000 |
Amendment $000 |
Restated balance $000 |
|---|---|---|---|
| Assets | |||
| Funds held by programme administrator | - | 60,230 | 60,230 |
| Liabilities | |||
| Provisions (current) | 499,730 | 60,230 | 559,960 |
| Impact on net assets | - | - | - |
9. Events after the Balance Date#
There have been no events after the balance date of 30 June 2025 (2024: Nil).
Notes
- [12] The majority of the revenue was from other departments that contributed towards the Policy Project and the Ministry of Foreign Affairs and Trade's contribution towards the Pacific Partnership Programme. Included in third party other revenue last year was $1.1 million contribution to the Pacific Programme received from the Ministry of Foreign Affairs and Trade which has now been reclassified to this category.
- [13] Other includes recruitment, staff training and attendance at conferences and seminars.
- [14] While some receivables are past due, including those outstanding for more than 90 days, no impairment provision has been recognised as a review of historical collection patterns, counterparty characteristics, and forward-looking information indicates no significant increase in credit risk. The Department considers these balances to be recoverable and the lifetime expected credit losses to be immaterial.
Appendices#
Tauāki pūtea
This section includes:
- Cabinet Office statistics
- Cabinet and Cabinet committee meeting statistics
- New Zealand Royal Honours
Cabinet Office statistics#
for the year ended 30 June 2025
| 2024/25 Actual |
2023/24 Actual |
2022/23 Actual |
|
|---|---|---|---|
| MEETINGS | |||
| Executive Council | 38 | 30 | 45 |
| Cabinet | 45 | 40 | 45 |
| Cabinet committees | 154 | 122 | 185 |
| Summary cover sheets to Cabinet and Cabinet committee papers |
1,498 | 1,229 | 1,735 |
| Submissions lodged by Ministers' offices by the Cabinet Office deadline |
94% | 81% | 81% |
| Papers published by the close of business, two days before the meeting |
99.55% | 90% | 93% |
| Cabinet and Cabinet committee minutes | 1,819 | 1,542 | 2,096 |
| Cabinet and Cabinet committee minutes requiring an amendment by the Cabinet Office[15] |
0 | 5 | 3 |
| Cabinet minutes published by the close of business, three days after the Cabinet meeting |
98.68% | 98% | 98% |
| Cabinet Office circulars | 5 | 14 | 7 |
| Briefing seminars to departments, Ministers' offices and other interested parties on the Cabinet decision-making process |
20 | 26 | 33 |
| Enquiries and requests from Ministers' offices and departments about Cabinet papers and related information |
81 | 129 | 119 |
Cabinet and Cabinet committee meeting statistics#
for the year ended 30 June 2025
| Number of Meetings |
Number of Agenda Items |
Average Number of Items per Meeting |
|
|---|---|---|---|
| Executive Council | 38[16] | 269 | 7 |
| Cabinet | 45 | 313 | 7 |
| CABINET COMMITTEE MEETINGS | |||
| Cabinet Appointments and Honours Committee | 28 | 285 | 10 |
| Cabinet Business Committee | 16 | 101 | 6 |
| Cabinet Economic Policy Committee | 28 | 264 | 9 |
| Cabinet Expenditure and Regulatory Review Committee | 17 | 107 | 6 |
| Cabinet Foreign Policy and National Security Committee | 7 | 30 | 4 |
| Cabinet Legislation Committee | 27 | 257 | 9 |
| Cabinet Social Outcomes Committee | 26 | 159 | 6 |
| Cabinet Strategy Committee | 5 | 12 | 2 |
| TOTAL CABINET COMMITTEE MEETINGS | 154 | 1,215 | 8 |
New Zealand Royal Honours#
for the year ended 30 June 2025
| THE NEW ZEALAND ORDER OF MERIT | |
| Dame Companion | 6 |
| Knight Companion | 6 |
| Companion | 28 |
| Officer | 74 |
| Member | 132 |
| Honorary Companion | 1 |
| Honorary Officer | 1 |
| Honorary Member | 1 |
| THE KING’S SERVICE ORDER | |
| Companion | 16 |
| The King's Service Medal | 108 |
| Honorary King's Service Medal | 2 |
| NEW ZEALAND BRAVERY AWARDS | |
| The New Zealand Bravery Star | 3 |
| The New Zealand Bravery Decoration | 10 |
| The New Zealand Bravery Medal | 25 |
| THE NEW ZEALAND ANTARCTIC MEDAL | |
| The New Zealand Antarctic Medal | 2 |
| THE NEW ZEALAND DISTINGUISHED SERVICE DECORATION | |
| The New Zealand Distinguished Service Decoration | 1 |
| TOTAL | 416 |
| OTHER HONOURS AND APPOINTMENTS | |
| Grant of the title “The Honourable” for life | 5 |
| TOTAL | 421 |
Areas of contribution for the New Year and the King's Birthday 2025 Honours Lists recipients
| Area of contribution | Female | Another Gender |
Male | Total |
|---|---|---|---|---|
| Arts and Media | 23 | 13 | 36 | |
| Business and the Economy | 10 | 25 | 35 | |
| Community, Voluntary and Local Services | 79 | 1 | 94 | 174 |
| Education | 20 | 15 | 35 | |
| Health | 22 | 13 | 35 | |
| Science and Technology | 7 | 11 | 18 | |
| Services to the State | 3 | 9 | 12 | |
| Sport and Recreation | 14 | 19 | 33 | |
| TOTAL | 178 | 1 | 199 | 378 |
Ethnicity of the New Year and the King's Birthday 2025 Honours Lists recipients
| Ethnicity | Female | Another Gender |
Male | Total | % of Lists |
|---|---|---|---|---|---|
| New Zealand European / European | 107 | 129 | 236 | 62.5 | |
| Māori | 33 | 1 | 32 | 66 | 17.5 |
| Pacific Peoples | 14 | 10 | 24 | 6.3 | |
| Asian | 13 | 13 | 26 | 6.9 | |
| Middle Eastern / Latin America / African | 1 | 1 | 2 | 0.5 | |
| Unspecified | 10 | 14 | 18 | 6.3 | |
| TOTAL | 178 | 1 | 199 | 378 |
Notes
Report by the Minister for Emergency Management and Recovery on Non‑departmental Appropriations #
This report meets the requirement, set in the Vote Prime Minister and Cabinet Estimates and Supplementary Estimates of Appropriations for 2024/25, for information on Non-departmental Appropriations to be reported by the Minister for Emergency Management and Recovery.
This report is presented to the House of Representatives pursuant to Section 19B of the Public Finance Act 1989.
Although presented in the same document, this report does not form part of the Department of the Prime Minister and Cabinet's Annual Report 2024/25.
Extreme Weather Events - Regional and Local Support #
This appropriation is intended to provide grants and other payments to support recovery from the sequence of 2023 North Island weather events.
What we achieved
| Performance measure | Target 2024/25 |
Result 2023/24 |
Result 2024/25 |
Achieved |
|---|---|---|---|---|
| Payments to support recovery efforts are made in accordance with criteria | 100% | 100% | 100% | ✔ |
How much it cost
| 2023/24 Actual $000 |
2024/25 Actual $000 |
2024/25 Budget $000 |
2024/25 Supp. Estimates $000 |
|
|---|---|---|---|---|
| 15,000 | Expenses | 24,930 | 25,000 | 25,000 |
Flood Resilience Projects#
This appropriation is intended to achieve the provision of funding from the Local Government Flood Resilience Co‑Investment Fund to support eligible flood risk mitigation initiatives.
What we achieved
| Performance measure | Target 2024/25 |
Result 2023/24 |
Result 2024/25 |
Achieved |
|---|---|---|---|---|
| Payments made to support flood resilience co-investment projects are made in accordance with agreed criteria | 100% | 63% | 60% | ✗ |
Why this measure was not achieved
One of the agreed criteria included payments made by National Infrastructure Funding and Finance Ltd (previously Crown Infrastructure Partners Ltd) to councils within 20 working days. This was not met and is slightly below last year's performance. Payments were processed late due to the Infrastructure Delivery team being involved in site visits and evidence verification processes taking longer than anticipated.
How much it cost
| 2023/24 Actual $000 |
2024/25 Actual $000 |
2024/25 Budget $000 |
2024/25 Supp. Estimates $000 |
|
|---|---|---|---|---|
| 11,122 | Expenses | 40,019 | 27,386 | 40,019 |
North Island Severe Weather Events#
This appropriation is intended to achieve provision of funding for the Future of Severely Affected Locations (FOSAL) process under which the Crown will be providing councils with financial support to deliver a series of specified transport and flood risk mitigation infrastructure projects (category 2), and property buyouts (category 3).
What we achieved
| Performance measure | Target 2024/25 |
Result 2023/24 |
Result 2024/25 |
Achieved |
|---|---|---|---|---|
| The Minister for Emergency Management and Recovery is satisfied with the advice and reporting on Future of Severely Affected Locations (FOSAL) implementation | 4 | 4.75 | 4 | ✔ |
| Payments made to support Category 2 risk mitigation projects are made in accordance with agreed criteria) | 100% | 100% | 50% | ✗ |
Why this measure was not achieved
One of the agreed criteria included payments made by National Infrastructure Funding and Finance Ltd (previously Crown Infrastructure Partners Ltd) to councils within 20 working days. This was not met and is slightly below last year's performance. Payments were processed late due to the Infrastructure Delivery team being involved in site visits and evidence verification processes taking longer than anticipated.
How much it cost
| 2023/24 Actual $000 |
2024/25 Actual $000 |
|
|---|---|---|
| Commenced: 27 September 2023 | ||
| Expires: 30 June 2028 | ||
| 1,722,524 | Original Appropriation | 1,722,524 |
| - | Cumulative Adjustments | 58,965 |
| 1,722,524 | TOTAL ADJUSTED APPROPRIATION | 1,781,489 |
| - | Cumulative Actual Expenditure as at 1 July | 778,660 |
| 778,660 | Current-year Actual Expenditure | 917,575 |
| 778,660 | CUMULATIVE ACTUAL EXPENDITURE AS AT 30 JUNE | 1,696,235 |
| 943,864 | Appropriation Remaining as at 30 June | 85,254 |
Local Authority Emergency Expenses PLA#
This appropriation is intended to achieve reimbursement of local authorities for the purposes of reimbursing, or meeting, expenses incurred by them in connection with an emergency as authorised by section 115A of the Civil Defence Emergency Management Act 2002.
What we achieved
| Performance measure | Target 2024/25 |
Result 2023/24 |
Result 2024/25 |
Achieved |
|---|---|---|---|---|
| Percentage of claims received are assessed in conjunction with approved criteria as set out in section 33 of the Guide to the National Civil Defence Emergency Management Plan 2015 | 100% | 100% | 100% | ✔ |
How much it cost
| 2023/24 Actual $000 |
2024/25 Actual $000 |
2024/25 Budget $000 |
2024/25 Supp. Estimates $000 |
|
|---|---|---|---|---|
| 21,964 | Expenses | 516 | 5,000 | 5,000 |