This is the second Child Poverty Related Indicators report, focusing on trends up to and including the 2019/20 year. The data are therefore a mix of pre- and during COVID-19.
Child Poverty Related Indicators are measures related to the broader causes and consequences of child poverty. Taken together, these indicators help tell a broader story about the lived experience of children living in poverty in New Zealand.
Overtime, they can also tell us more about the impact of policies established to reduce child poverty and mitigate its consequences.
Formats
Reporting on the child poverty related indicators#
Reducing child poverty is a priority for this Government. For individual children, poverty is about growing up in a household that experiences financial hardship and the stress that comes from having to make decisions that involve trade-offs between basic needs. The experience of poverty can involve various forms of hardship, such as going hungry, living in cold, damp houses, and missing opportunities that many take for granted, like attending a birthday party or joining a sports team.
Evidence shows that the experience of poverty in childhood, especially when that experience is severe and/or persistent, can have negative lifelong impacts. Children who grow up in poverty are more likely, on average, to experience poorer educational outcomes, poorer health, and have more difficulty finding work in adulthood. The harmful effects also impact on society as a whole.
That is why this Government is tackling the long-term challenge of child poverty in New Zealand, in order to make it the best place in the world to be a child.
In order to get a more well-rounded understanding of the experiences of hardship for children and how we are making progress, the Government reports annually on Child Poverty Related Indicators (CPRIs). The CPRIs are a requirement of the ground-breaking Child Poverty Reduction Act 2018 (the Act), which was passed in December 2018. The legislation ensures successive Governments are held to account on progress on reducing child poverty in New Zealand. The Government has chosen five CPRIs that relate to the wider causes and consequences of poverty, and/or outcomes with a clear link to child poverty. These are currently:
- Housing affordability – the percentage of children and young people (ages 0-17) living in households spending more than 30 percent of their disposable income on housing.
- Housing quality – the percentage of children and young people (ages 0-17) living in households with a major problem with dampness or mould.
- Food insecurity – the percentage of children (ages 0-15) living in households reporting food runs out often or sometimes.
- Regular school attendance – the percentage of children and young people (ages 6-16) who are regularly attending school.
- Potentially avoidable hospitalisations – the rate of children (ages 0-15) hospitalised for potentially avoidable illnesses.
Taken together, these indicators help tell a broader story about life for children living in poverty in New Zealand, now and in the future. They provide context beyond what we can understand from observing trends against the income and material hardship primary and supplementary measures of child poverty. Over time, they can also tell us more about the real-world impact of the policies we've put in place to reduce child poverty and mitigate its consequences.
This is the second Child Poverty Related Indicators (CPRI) report, focusing on trends up to and including the 2019/20 year. The data are therefore a mix of pre- and during COVID-19 results.
These CPRIs are also used as indicators for three of the six outcome areas in the Child and Youth Wellbeing Strategy: 'Children and young people have what they need', 'Children and young people are happy and healthy' and 'Children and young people are learning and developing'.
The Child and Youth Wellbeing Strategy indicators tell a more comprehensive story about child and youth wellbeing in New Zealand. The annual report on progress against the Strategy's outcomes is being published alongside this report, and can be found on the Child and Youth Wellbeing website.
At a glance: Key indicators#
Housing affordability#
In 2019/20, 36% of households with children (aged 0-17) spent more than 30% of their disposable income on housing
- 32% of Māori households with children spent more than 30% of their disposable income on housing; in the case of Pacific households, this was 34%.
- The rates for children with disabilities, or in households with at least one disabled person, was 35% and 33%, respectively.
Housing quality#
In 2019/20, 7% of children (ages 0-17) lived in households with a major problem with dampness or mould
- There is some evidence of a downward trend in the percentage of children in households with major dampness or mould.
- Housing quality issues are more severe for Māori and Pacific children. 11% of Māori children and 17% of Pacific children lived in households with a major problem with damp or mould.
- For children with disabilities, and children living in households with a disabled family member, 10% and 11% had a major problem with dampness or mould respectively.
Food security#
In 2019/20, 20% of children (ages 0-15) reported living in households where food runs out sometimes or often, with 4% reporting often
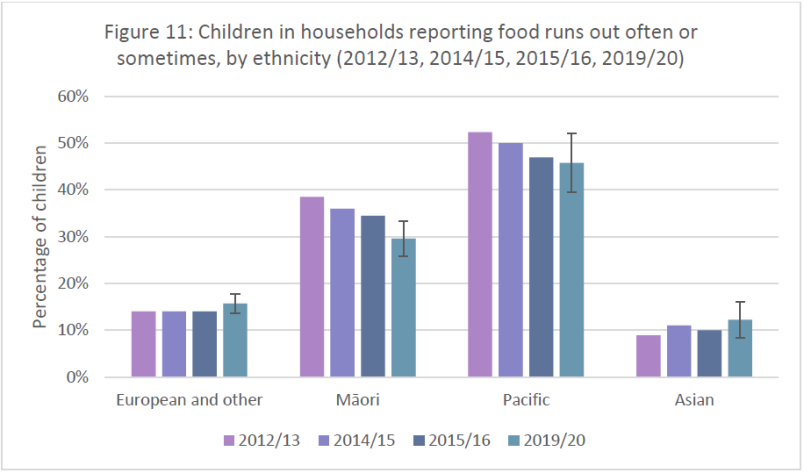
- The proportion of Māori and Pacific children living in houses where food runs out sometimes or often were 30% and 46%, respectively.
- The proportion of Māori and Pacific children living in houses where food runs out often were 8% and 10%, respectively.
- There is some evidence that food insecurity decreased over 2012 to 2020 for Māori and Pacific children
Regular school attendance#
In 2020, 65% of students (ages 6-16) regularly attended school
- Regular attendance means attending school 90% of the time. Regular school attendance was lower for Māori and Pacific children: 48% and 51%, respectively.
Potentially avoidable hospitalisations#
In 2019/20 the rate of potentially avoidable hospitalisations in 0-14 year olds was 49 per 1,000
- This rate was higher for Māori and Pacific children - 56 and 72 per 1000 children respectively.
- Over the five years to 2019/20, rates of potentially avoidable hospitalisations have been decreasing.
At a glance#
- Increased the Accommodation Supplement as part of the Families Package
- Extended free and low-cost doctors' visits for children under the age of 14 enrolled with a GP, reaching 56,000 more young people
- Increased the supply of public housing by over 6,400 places over four years
- Provided funding during COVID-19 for devices and connectivity to enable student access to online learning
- Invested in the Māori Housing Network to provide additional papakāinga
- Lowered the cost of visiting a doctor or nurse for adults with a Community Services Card, and their dependants aged 14 to 17 years
- Implementing the Healthy Homes Guarantee Act 2017 and setting the Healthy Homes Standards
- Introduced the Warmer Kiwi Homes programme
- Introduced our programme to provide free period products in schools
- Expanded and enhanced school-based health services to reach over 96,700 students across nearly 300 schools
- Introduced the Winter Energy Payment, as part of the Families Package
- Introduced and expanded the free and healthy lunches in schools programme, to over 200,000 Year 1-13 students
- Increased benefits by $25 a week
- Introduced two pilots in South Auckland and Kawerau to pilot a new design of the Attendance Service
- Supporting food banks and food rescue organisations through the Food Secure Communities programme
Housing affordability (Ages 0-17)#
Housing affordability is a significant issue affecting many New Zealand families. Unaffordable housing often leaves families with insufficient money to cover basic household needs such as healthy food, heating, clothing, and transport costs.[1] The additional financial stress and burden of unaffordable housing on parents can negatively impact parental relationships, and parental mental health and health behaviours, which can in turn influence children's health and developmental outcomes.[2]
Attempts to reduce costs can bring different risks to child wellbeing; for example, living in a house that is too small, cold, poor quality, in an unsuitable location, or overcrowded. Living in a crowded house greatly increases the risk of transmission and experience of communicable diseases and respiratory infection.[3] It can also mean severely reduced personal space and privacy, inadequate space for children to do homework or study, and increases the chances of relational stress.[4]
Housing affordability can be measured in a number of ways. Spending more than 30% of disposable household income on housing costs is generally considered unaffordable. In line with this, the CPRI for housing affordability is the proportion of children (ages 0-17) living in households spending more than 30% of their disposable income on housing costs. It is calculated using a ratio of gross housing costs (rates, dwelling insurance, mortgage and rent) to household disposable income (which takes into account taxes and transfer payments). We also report on the proportion of households spending more than 40% and 50% of their disposable income on housing costs. These households are disproportionately from lower income households.
This indicator is used for the outcome area 'children and young people have what they need' in the Child and Youth Wellbeing Strategy, as seen in the annual report on progress published alongside this report. The Household Economic Survey was paused in March 2020, and so the data for this indicator relate to the time before the first COVID-19 lockdown.
Rates and trends for housing affordability#
In 2019/20, 36% of children and young people (ages 0-17) lived in households spending more than 30% of their disposable income on housing. This is higher than the 2018/19 level of 35%, although due to the sample error we cannot tell if this reflects a real increase at this stage.

Source: Household Economic Survey, Stats NZ
These recent changes should be seen within the context of longer-run trends for housing affordability, which are provided in the Ministry of Social Development's Household Incomes Report. This shows that the proportion of all households (excluding superannuitant households) spending more than 30% on housing increased from around one in seven (14%) in the late 1980s to around one in three (35%) in the late 2000s, where it has broadly remained since.
It is important to note that this indicator will not necessarily reflect all changes in housing costs or house prices. For example, if some people had their rent or mortgage increase from 31% to 39% of their income, this would not move the indicator. The indicator will also not change if mortgages are larger but spread over a longer time period, if the ongoing costs to the household stay the same. However, the indicator does increase when a greater proportion of people have housing costs that increase to 30% or more for the first time. The indicator will also reflect rising house prices, although the impact may be offset by other factors such as rising incomes.
Rates for different socioeconomic groups#
There are large differences between socioeconomic groups for this indicator. A greater proportion of children from low income households live in households that spend more than 30% of their income on housing costs. This is also true for those with a higher percentage of housing costs, with 55% of lowest income households spending more than 30% of their income on housing and over 30% of this group spending more than 50%.
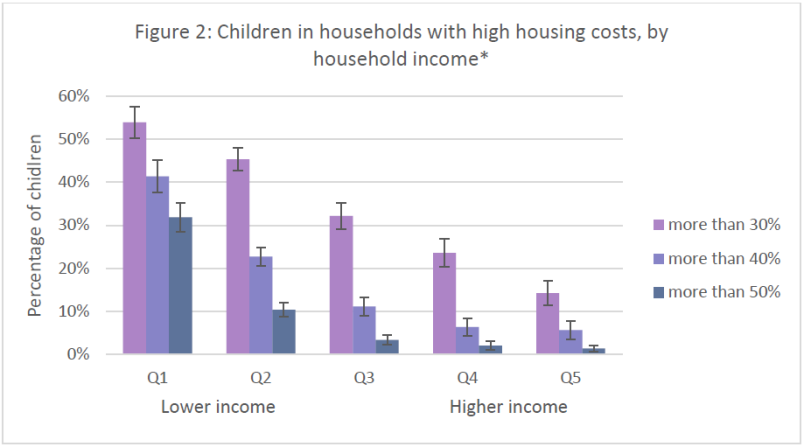
Source: Household Economic Survey 2019/20, Statistics NZ
By ethnicity, there are no statistically significant differences between European, Māori, or Pacific children, although Asian children have higher rates of living in households with high housing costs.
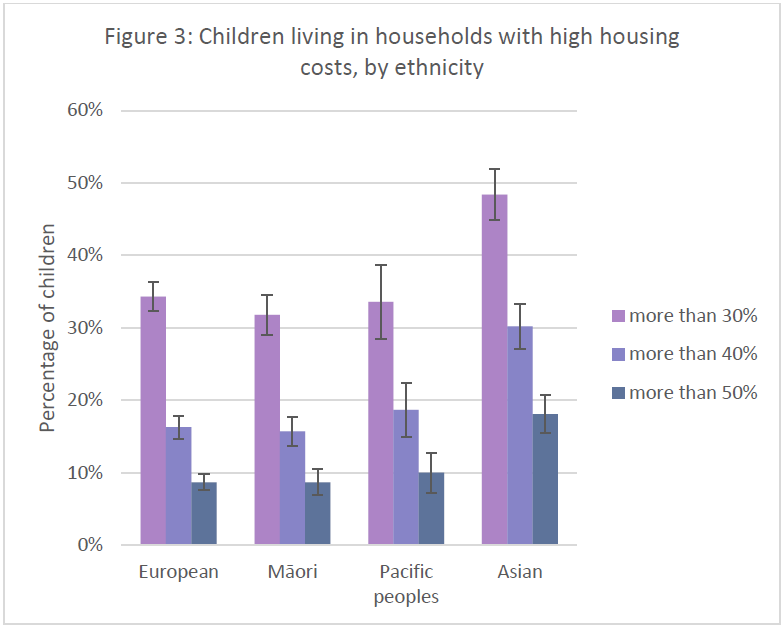
Source: Household Economic Survey 2019/20, Statistics NZ
Children living in dwellings that are owned or partially owned by the usual residents have lower rates on all three measures, compared to those who rent or do not own their home. Children in single parent households also have higher rates on all three measures compared to couples with one or more children.
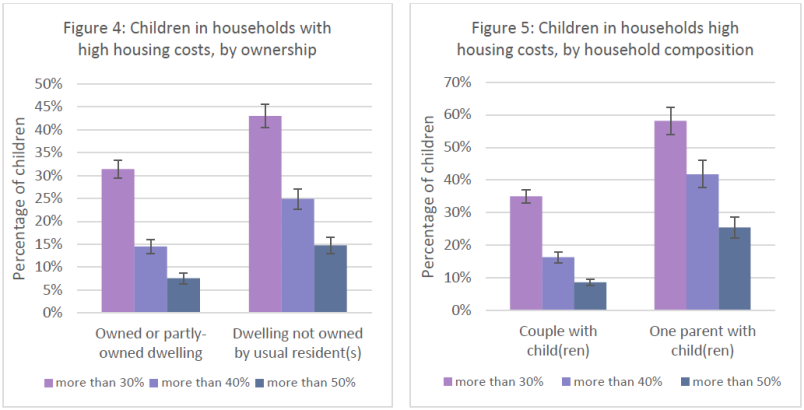
Source: Household Economic Survey 2019/20, Statistics NZ
Other key observations#
This year, Statistics NZ have calculated the percentages of children living in households spending more than 30% of their income on housing for both children with disabilities, and children in households with at least one disabled person. These rates resemble the rates for children in the overall population at 36% and 33% respectively.
There are likely to be particular groups who face worsening affordability outcomes that are not picked up by the measures. In particular, prior to 2018 beneficiaries living in private rental accommodation were likely to have faced rents that increased in real terms, while incomes remained broadly flat. However, since 2018, the Government has provided significant increases in incomes to many families through the Families Package and the COVID-19 response, and has also indexed benefits to wage growth from 1 April 2020. Importantly, the Household Economic Survey (HES) data does not capture people living in non-private dwellings (i.e. living in motels, boarding houses or camping grounds), who are likely to face the most significant challenges with their housing situation.
To improve housing affordability, we have:
- Extended the Apprenticeship Boost payment to help build our construction workforce.
- Increased the Accommodation Supplement as part of the Families Package. The first stocktake since the implementation of the Families Package showed people receiving the Accommodation Supplement got an average increase from $71 to $98 a week.
- Introduced the Urban Growth Agenda to remove barriers to the supply of land and infrastructure and make room for cities to grow up and out.
- Increased the supply of public housing by over 6,400 places over four years, to bring the total number of public housing places in New Zealand to 73,628 by June 2022.
- Increased funding for Housing Support Products to help an additional 2,250 people per year access new housing or sustain their existing accommodation.
- Expanded Housing First to a total of 2,700 places to improve the social and housing outcomes of chronically homeless people and their families and whānau.
- Invested to maintain transitional housing places at approximately 2,800, and increase supply in the short term with 1,000 extra placed funded as part of the Aotearoa New Zealand Homelessness Action Plan.
- Reduced the deposit required for a First Home Grant and Loan to five percent, making it easier for first home buyers to get a deposit together.
- Enabled family and friends buying a home together to each receive their full First Home Grant amount.
- Made $400 million available to support more New Zealanders into home ownership by increasing support for progressive home ownership products, such as shared equity and rent-to-buy schemes.
- Invested in the Māori Housing Network to provide additional papakāinga (Māori collectively owned homes), housing repairs, and capability building programmes.
- Increased benefits by $25 a week, and indexed benefits to wage growth.
In response to COVID-19 we have:
- Protected housing costs for renters by providing a six month freeze on residential rent increases and increased protection from tenancy terminations.
- Worked with the major retail banks on mortgage deferrals for homeowners.
- Committed to deliver 8,000 new public and transitional housing places so that more New Zealanders can have a place to call home that is warm, dry and safe.
- Increased funding for the Ministry of Social Development's rent arrears assistance product to allow more people to access support to meet their housing costs.
2021 and onwards, we are:
- Partnering with Māori through MAIHI to support the implementation of the Homelessness Action Plan, repairing and maintaining homes, building papakāinga and establishing the Iwi Māori pathway for progressive home ownership.
- Increasing the income and price caps on First Home Loans and First Home Grants.
- Extending the bright line test from 5 to 10 years.
- Closing the loophole that allowed property speculators to write off interest costs against their rental income.
- Launching a $3.8 billion Housing Acceleration Fund to speed up the pace and scale of housing building.
Housing quality (Ages 0-17)#
Living in a safe, warm, dry home is essential to children's wellbeing. In addition to its impact on immediate wellbeing, living in low-quality housing makes children more likely to experience poor health, including respiratory illnesses and infections.[5]
It is estimated that around 30,000 children are hospitalised every year from preventable, housing-related diseases like asthma, pneumonia and bronchiolitis, with hospitalisation rates peaking in winter.[6] Young children are particularly vulnerable to the effects of poor housing as they spend proportionally more time indoors. Children and infants are also more susceptible to indoor air pollutants, as their immune systems are still maturing.[7]
There is a strong relationship between poor quality housing and poverty. The majority of lower-income families are living in rental accommodation which offers less security and stability and is often of poorer quality.[8] A lack of income can be a barrier to accessing quality housing, especially in the context of increasing house prices, high and increasing rental costs, and the lower quality of houses available for rent. Low quality housing can also lead to further pressure on the household budget, as extra costs are incurred to keep un-insulated, cold houses warm, and also to access medical care.[9]
The CPRI for housing quality is the percentage of children (ages 0-17) living in households with a major* problem with dampness or mould over the past 12 months.
This indicator is used for the outcome area 'children and young people have what they need' in the Child and Youth Wellbeing Strategy, as seen in the annual report on progress published alongside this report. The Household Economic Survey was paused in March 2020, and so the data for this indicator relate to the time before the first COVID-19 lockdown.
Rates and trends for housing quality#
In 2018/19, 7% of children and young people (ages 0-17) lived in households reporting a major problem with dampness or mould. Although the change from last year is not statistically significant, there is some evidence of a downward trend.
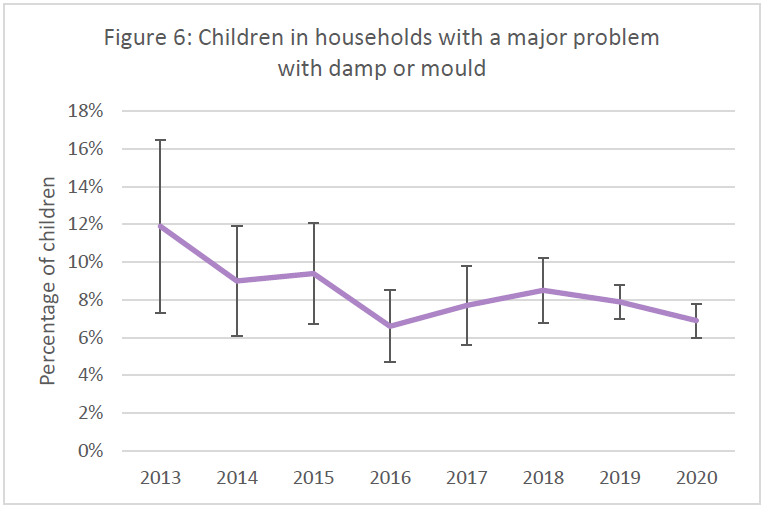
Source: Household Economic Survey, Stats NZ
However, it is still too early to know for sure, as sample sizes for earlier HES were relatively small, and there were some reliability issues with HES data for 2015/16.[10]
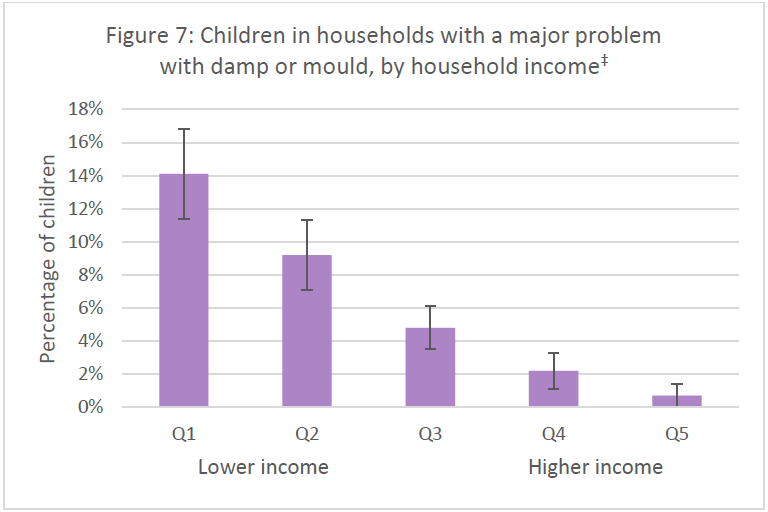
Rates for different socioeconomic groups#
There are significant differences in housing quality for different socioeconomic groups. Over 13% of low-income households have a major problem with damp or mould, compared to 7% for the total population.
Source: Household Economic Survey 2019/20, Stats NZ
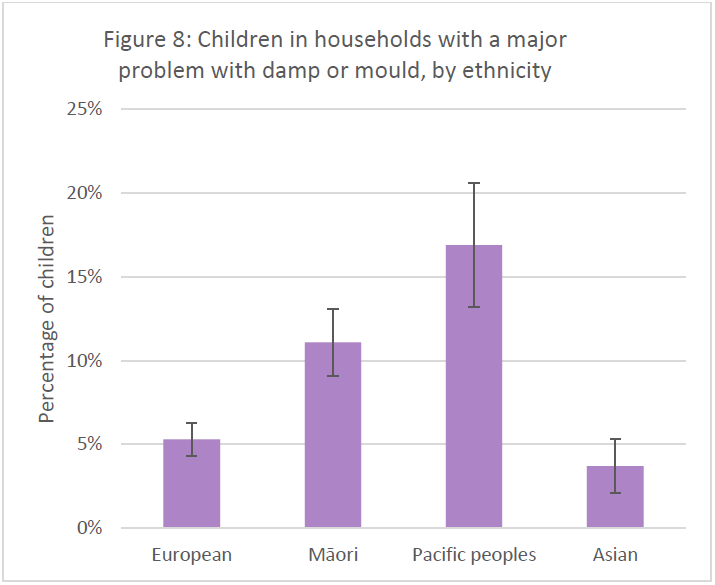
Rates for different ethnic groups#
Housing quality issues are more common for Māori and Pacific children, with 17% of Pacific children and 11% of Māori children experiencing a major problem with dampness or mould. There have been no statistically significant changes for these groups compared to the previous year.
Source: Household Economic Survey 2019/20, Stats NZ
Other key observations#
This year, Stats NZ have released data for children with disabilities, and children living in households with a disabled family member. For these groups, 10% and 11% have a major problem with dampness or mould respectively. The rate is also higher for sole parents (14%) compared to couples with children (5%).
Housing quality issues are also strongly related to tenure, with a significant proportion of children living in households not owning their own home reporting a major problem with dampness or mould (14% in 2019/20), compared with households living in owner-occupied dwellings (2%). This is broadly consistent with earlier Ministry of Social Development reporting on tenure (14% and 4% respectively). Ministry of Social Development reporting also notes that 34% of those in state or social housing report such issues.[11]
To improve housing quality, we have:
- Improved the quality of housing and conditions for renters by implementing the Healthy Homes Guarantee Act 2017 and setting the Healthy Homes Standards. The Standards set minimum requirements for heating, insulation, ventilation, moisture and drainage, and draught stopping in residential rental properties, based on feedback from a wide range of public health experts and stakeholders including landlords, tenants and building experts. These changes are legislated for in the Residential Tenancies (Healthy Homes Standards) Regulations 2019.
- Introduced the Warmer Kiwi Homes programme that offers grants to cover 90% of the cost of ceiling and underfloor insulation. The programme also provides capped grants for heat pumps, wood burners and pellet burners. Government funded grants are topped up wherever possible by funding from community organisations. Homeowners with a Community Services Card and those living in a lower-income area may qualify for a grant under this programme.
- Introduced the Winter Energy Payment, as part of the Families Package, to help those on a main benefit, receiving Superannuation or a Veteran's Pension with the cost of heating their homes over winter.
In response to COVID-19, we have:
- Doubled the Winter Energy Payment for 2020 to support beneficiaries and superannuitants to remain safe and well at home this winter. This payment gives beneficiaries and superannuitants $40.91 per week (for single people) and $63.64 per week (for couples or people with dependants).
- Expanded the Warmer Kiwi Homes programme and set aside funding to deliver subsidised insulation and heating retrofits in houses occupied by low-income owners.
2021 and onwards, we are:
- Expanding the Ministry of Health's Healthy Homes Initiative to improve the quality of housing to prevent childhood hospitalisations.
- Partnering with Māori through MAIHI to support the implementation of the Homelessness Action Plan, repairing and maintaining homes, building papakāinga and establishing the Iwi Māori pathway for progressive home ownership.
- Supporting energy efficiency, including through new mandatory Energy Efficiency Certificates to support homeowners to reduce their power and energy costs.
- Continuing to implement the recommendations following the Electricity Price Review, with a particular focus on alleviating energy hardship.
Food insecurity (Ages 0-15)#
Food insecurity means not having reliable access to sufficient safe and nutritious food to lead a healthy and productive life, and meet cultural needs.[12] Both New Zealand and international research indicates a strong relationship between food insecurity and low income. When disposable income is limited, quality and quantity of food is often one of the first items that is compromised.[13]
Food security is essential for children and young people to be happy and healthy, and learning and developing. Children living in food insecure households are less likely to consume nutritionally balanced diets which are essential for optimal growth and development. This can have immediate and long-term negative consequences for their health and education.[14], [15] Household food insecurity has been associated with a wide range of child health and development problems from infancy through to adolescence, including child obesity,[16] poor academic performance, and developmental and behavioural problems.[17]
Food insecurity contributes to family stress and can damage wellbeing when caregivers feel anxious about providing food, or are forced to rely on charity or emergency assistance programmes to feed their family. Although caregivers often shield children from the severity of the household's food insecurity by moderating their own food consumption, the increased stress on them and their families and whānau can also impact on parental mental health and parent-child relationships.[18] Family meals can also be an important way for families to spend quality time together, and in food insecure households this experience may be compromised.
The indicator for food insecurity is the percentage of children (aged 0-15) living in households reporting that food runs out often or sometimes, drawing on data from the New Zealand Health Survey. There is a gap in the data available as this question was removed from the Health Survey in 2016/17 and reinstated in 2019/20, and will be included going forward. The Health Survey was paused due to the COVID lockdowns and therefore this data is 'pre-COVID'.
This indicator is used for the outcome area 'children and young people have what they need' in the Child and Youth Wellbeing Strategy, as seen in the annual report on progress published alongside this report.
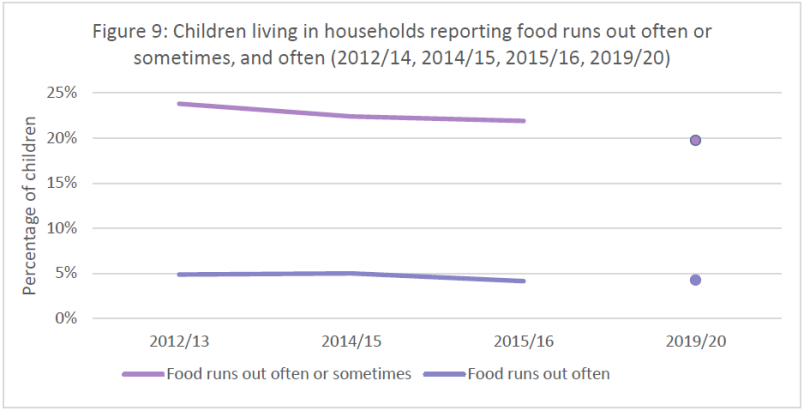
Rates and trends for food insecurity#
In 2019/20, 20% of children aged 0-15 lived in households reporting that food ran out often or sometimes. There is some evidence of a downwards trend, although the sample sizes are too small to say with confidence. Only 4% of children live in households reporting that food runs out often, and this has been stable over time.
Source: NZ Health Survey, Ministry of Health
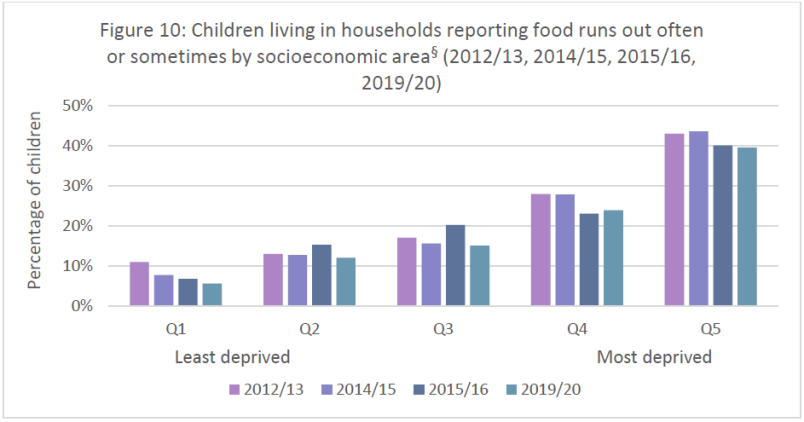
Rates for different socioeconomic groups#
Food insecurity and socioeconomic deprivation are strongly correlated. In 2019/20, 40% of children from lower socioeconomic households (NZDep13 quintile 5) experienced food running out sometimes or often, compared to just 6% of those in the least deprived areas (quintile 1).
While some progress has been made in reducing food insecurity for children aged 0-15 overall, a gap remains between the experiences of children living in households in the least and most deprived areas, which has not narrowed over time.
Source: NZ Health Survey, Ministry of Health
Rates for different ethnic groups#
Food insecurity is disproportionately more prevalent amongst Māori and Pacific children and families. Although there have been declines for Māori and Pacific households, the differences between ethnic groups remain. However, previous analysis on food insecurity has noted that after adjusting for household income and size, the differences in food insecurity for different ethnic groups are no longer statistically significant. This indicates that the differences between ethnic groups are related to income and family structure – larger households and families on lower incomes tend to experience worse food insecurity.[19], [20], [21]
Source: NZ Health Survey, Ministry of Health
There is some evidence that food insecurity decreased over 2012 to 2020 for Māori and Pacific children. However, we know that COVID-19 has potentially disrupted this trend, which will become clear in next year's report.
Other key observations#
The Ministry of Social Development (MSD) saw an increase in Special Needs Grants for food in 2020 during the COVID-19 lockdown. During this time, the total available amount that people could access online for food grants temporarily increased. Although the numbers of food grants decreased through August to October, levels are now higher than at the same time the previous year. Along with the level of underlying need, trends for hardship assistance are also driven by operational changes by MSD, which have made it easier to access food grants.
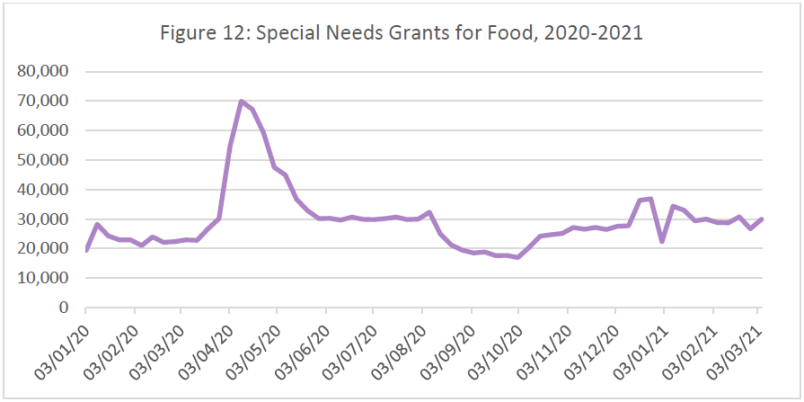
Source: Ministry for Social Development
Foodbank use has also been reported to have increased over this time.[22] However, it is important to note that this could be driven by a few different factors, including:
- an increase in need that is likely to continue over the longer term, due to people losing their jobs and facing sudden financial pressure;
- an increase in need that was specific to the lockdown, such as people being cut off from support networks and other factors unique to being stuck in their homes;
- an increase in Government funding to foodbanks, resulting in more people being able to access the service.
It is clear that food insecurity is an issue for children in New Zealand, in particular for Māori and Pacific children and children living in areas of high deprivation.
To improve food security, we have:
- Introduced a prototype programme to deliver free and healthy lunches in schools. The programme was introduced at the beginning of Term 1 2020 in 31 schools facing greater socioeconomic barriers in the Bay of Plenty/Waiariki and Hawke's Bay/Tairāwhiti, delivering lunch to around 7,000 students every day. Up to 21,000 students in around 120 schools will benefit from this pilot from the beginning of 2021. By providing healthy lunches, the programme aims to address barriers to school attendance and participation; support concentration, behaviour and achievement; boost overall student health and wellbeing; and reduce financial hardship facing families and whānau. The impact of the programme on these outcomes is being evaluated.
- Continued our funding support for the provision of food in schools through the KickStart Breakfast and KidsCan Food for Kids programmes.
In response to COVID-19, we have:
- Expanded Ka Ora Ka Ako, the free and healthy lunches in schools programme, to over 200,000 Year 1-13 students in schools with the highest disadvantage.
- Scaled up existing programmes in schools and communities to provide an additional 10,000 fruit and vegetable boxes a week for 10 weeks.
- Provided $32 million in additional support to foodbanks, food rescue and community food services.
- Increased funding for marae and Whanau Ora to support communities in response to COVID-19.
From 2021 onwards, we are:
- Continuing to support communities through the Ministry of Social Development Food Secure Communities programme.
- Continuing to work with the New Zealand Food Network to distribute bulk surplus and donated food from national food producers, growers, and wholesalers through to food rescue and foodbanks around New Zealand.
Regular school attendance (Ages 6-16)#
Regular school attendance is important for student achievement and wellbeing, both in the short and long term. Sustained absence affects educational achievement and can lead to significantly diminished opportunities later in life. A New Zealand study found a strong relationship between student attendance during Year 10 and achievement in senior secondary school, with each additional absence predicting a consistent reduction in the number of NCEA credits a student subsequently attains.[23]
It is also likely that attendance impacts and is impacted by other aspects of subjective wellbeing. Research shows links between skipping school and schoolwork-related anxiety, bullying, a diminished sense of belonging, and lower levels of motivation. In every case, students who report skipping no days of school reported the best wellbeing outcomes.[24]
Poverty and disadvantage can also pose a barrier to regular school attendance. Some children and young people may stay at home to look after younger siblings while parents and caregivers work, or work themselves to supplement family incomes. Others face particular challenges to maintaining regular attendance due to insecure housing and regularly moving to different areas, and illnesses associated with disadvantage (including poor housing quality, overcrowding, and lack of access to primary health services). Lack of money to pay for school uniforms, period products, PE gear, lunches, devices, or travel to school can also make regular attendance a challenge.[25],[26]
The child poverty related indicator for regular attendance is the percentage of children and young people (ages 6-16) who are regularly attending school, based on the School Attendance survey. Students are classified as regularly attending school if they have attended more than 90% of Term 2, where time is measured in half-days. Students are otherwise classified into 'irregular' attendance (attended 81-90% of the time), 'moderate' attendance (71-80% of the time), and 'chronically absent' (less than 70%) brackets. Absences can be classified as either justified (e.g. illness), or unjustified (e.g. truancy).
The data usually covers attendance for all of Term 2. Due to the COVID-19 lockdown, the data for 2020 only covers the last 7 weeks of Term 2 when students physically attended schools (18 May 2020 to 3 July 2020) and counts students who were enrolled for a minimum of one half-day. Note that in all other years, students were only counted if they were enrolled for a minimum of 30 half-days.
This indicator is used for the outcome area 'children and young people are learning and developing' in the Child and Youth Wellbeing Strategy, as seen in the annual report on progress published alongside this report.
Rates and trends for regular school attendance#
In 2020, 65% of students (ages 6-16) attended school regularly in term 2. This was up from 59% in 2019, and 64% in 2018.
In our previous report, we noted that the Ministry of Education is reporting a trend of declining regular attendance from 2015 to 2019. It is possible that 2019 is an outlier because regular attendance is unusually low, with a corresponding increase in irregular attendance, and so we should not place too much importance on this year when looking for trends. 2020 may also be an outlier, due to the impact of COVID-19. As some of the graphs below show, the data for 2020 show some unexpected changes. Due to the uncertainty, it is best to wait for future data before drawing any conclusions about the trends.
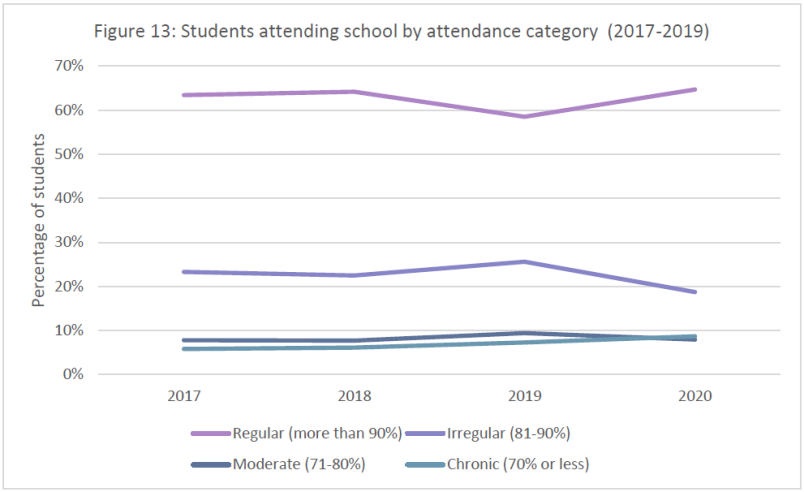
Source: Attendance Survey, Ministry of Education[§]
Rates for different socioeconomic groups#
Regular attendance is associated with school decile, with lower regular attendance in lower decile schools. The change in attendance from 2019 to 2020 also differs across deciles. Attendance has improved in the top five deciles, but attendance has dropped from typical levels in deciles 1 and 2, increasing the gap between those at the bottom and those at the top.
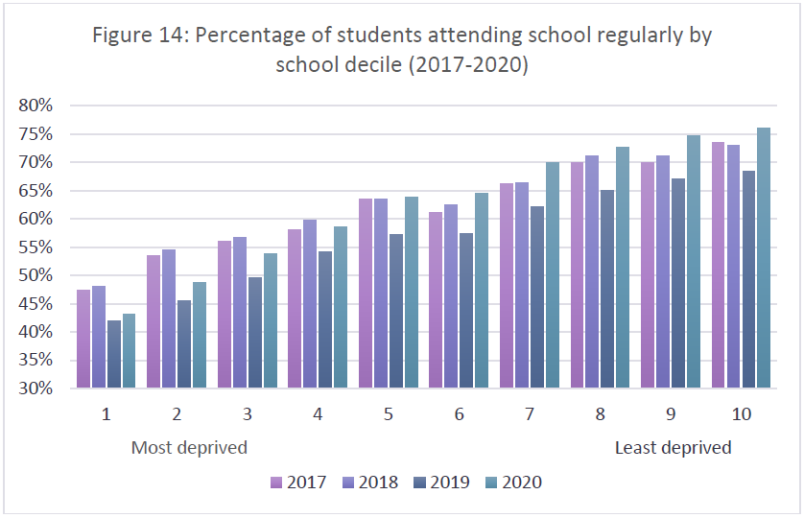
Source: Attendance Survey, Ministry of Education
Rates for different ethnic groups#
Māori and Pacific children have lower than average regular attendance. In 2020, 48% of Māori children and 51% of Pacific children aged 6-16 attended school regularly, compared with an average across all students of 65%. This pattern is also consistent when looking back at attendance in earlier years.
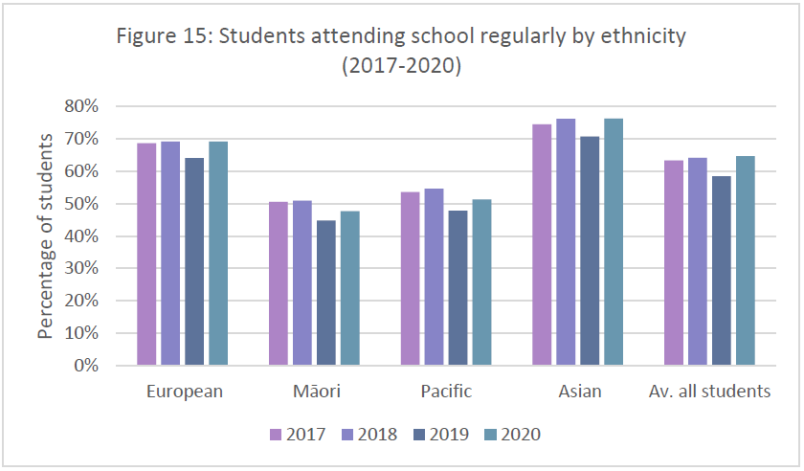
Source: Attendance Survey, Ministry of Education
Māori and Pacific children have not seen attendance rates return to 2017/18 levels after the dip in 2019, unlike other ethnicities. However, there is evidence that fewer Māori and Pacific children are leaving school altogether, post COVID-19.[27] As noted by the Ministry of Education, "we know from school and community reports that there are cases where COVID-19 is negatively impacting on students' ability to remain in schooling. Yet the broader data suggests that for every student in this situation this year, there may have been just as many (if not more) similar students experiencing different pressures in previous years. In this way, COVID-19 might simply be directing attention to existing societal inequities."[28] The Ministry of Education also reports lower attendance at Māori medium schools.[29]
Other key observations#
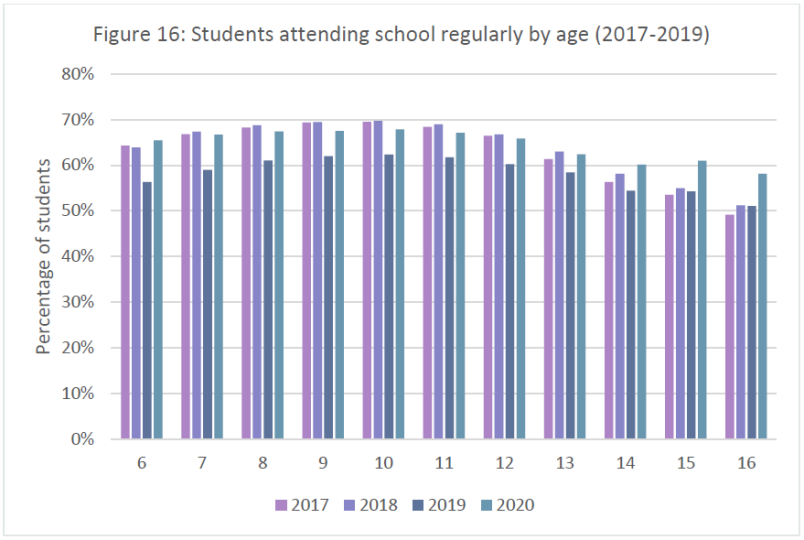
Regular attendance usually peaks at around the ages of 9-11, before dropping off as students get older. In 2020, attendance rates for primary aged children reverted to previous levels, following a drop in the 2019 year. However, for 14-16 year olds, attendance increased markedly in 2020, which may be a response to the COVID-19 lockdown.
Source: Attendance Survey, Ministry of Education
To improve regular attendance, we have:
- Introduced two pilots in South Auckland and Kawerau to trial a new design of the Attendance Service, with a view to changing the nationwide service offering over the medium-term.
- Initiated a review of the codes used to record a student's presence or absence, as well as collecting attendance data across the year to gain richer insights into the reasons for non-attendance.
- Initiated an innovation project focusing on attendance, which will trial interventions to make a difference in improving attendance. The Ministry is working with The Southern Initiative/Auckland Co-Lab and the Innovation Unit to explore insights, ideas and prototypes that could support a response to this challenge in Manurewa and the Bay of Plenty.
- Worked closely with schools and with other agencies (e.g. Oranga Tamariki, the Ministry of Social Development and Police) to improve attendance and engagement, and sharing good practice with schools.
- Worked closely with our providers who support schools, whanau, and students to ensure that there is a focus on supporting attendance and engagement.
- Engaged in a social media campaign to encourage parents to ensure their children are at school every day they are well enough to be there, reaching 100,475 people across Twitter and Facebook between February and March 2020.
In response to COVID-19, we have:
- Expanded Ka Ora Ka Ako: free and healthy lunches in schools to provide lunch to over 200,000 year 1 to 13 students by the end of 2020.
- Provided emergency funding for television content and hard copy learning packs to supplement distance learning for early childhood education and schooling, to maintain engagement while schools were closed during the COVID-19 containment period.
- Provided funding for devices and connectivity to enable student access to online learning.
- Provided advice, guidance and support for early learning services, schools and kura through each alert level and in preparation to open.
- Implemented a $50 million Urgent Response Fund to respond to learners' needs related to attendance, re-engagement with learning, and wellbeing to support attendance (including cultural wellbeing) following COVID-19 lockdowns.
- Implemented a national plan for working collectively with schools on new attendance and engagement approaches to support all children and young people to return to early learning, school and kura following the COVID-19 containment period.
- Worked across agencies to help identify and support absentee/non engaged families.
- Supported education providers to tailor their services and supports to parents and whānau with a focus on attendance and engagement.
- Topped up the School High Health Needs Fund that provides teachers' aide support for students with high health needs so they can attend school safely.
From 2021 onwards, we are:
- Expanding our programme to provide free period products in schools across New Zealand.
Potentially avoidable hospitalisations (Ages 0-15)#
Every year thousands of children across New Zealand are admitted to hospital with avoidable illnesses and injuries.[30] Potentially avoidable hospitalisations (PAH) include illnesses and injuries that can be prevented through more effective primary health care services, or broader public health and social policy interventions that target the underlying determinants of health.
Potentially avoidable hospitalisations include respiratory conditions, gastroenteritis, skin infections, tooth decay, vaccine preventable illnesses, and physical injuries. Health issues in childhood not only immediately effect the child, but can also have an impact on longer term health outcomes. Many adult health problems have roots in childhood experiences, such as chronic lung disease among adults, cardiovascular disease, mental illness, dental decay, and shortened life expectancy.[31] Exposure to tobacco smoke, poor housing conditions, inadequate or poor nutrition and oral hygiene, and failure to vaccinate are just some of the drivers of potentially avoidable hospitalisations for children.
For some children in New Zealand, low income can be a barrier to accessing primary health care in order to treat illnesses and receive vaccinations.[32] This can include the cost and time of travelling to a health centre, or parents taking time away from work to attend appointments with their children. Low income also acts as a barrier to accessing better quality housing and a healthy diet, both of which are strongly related to poor health outcomes.[33]
This indicator looks at the rate of children ages 0-15(*) hospitalised for potentially avoidable illnesses and injuries, based on data collected by the Ministry of Health. Data for this indicator includes hospitalisation as a result of intentional and unintentional injuries, which are part of the Ministry of Health's official definition of potentially avoidable hospitalisations.
The latest data sets were collected from July 2019 to June 2020, and so include data from both before and during the level four COVID-19 lockdown. Although essential health services were still open during levels 3 and 4 of the lockdown, there were a number of reasons that people may not have accessed services, including uncertainty about what was an essential health need, restricted transport options, and fear of being infected with COVID-19.
This indicator is used for the outcome area 'children and young people are happy and healthy' in the Child and Youth Wellbeing Strategy, as seen in the annual report on progress published alongside this report.
Rates and trends for this child poverty related indicator#
In 2019/20, the rate of potentially avoidable hospitalisations was 49 per 1,000 children (ages 0-15). This is a notable drop compared to previous years.
Over the five years to 2019/20, rates of potentially avoidable hospitalisations have been decreasing, from 67 potentially avoidable hospitalisations per 1,000 children aged 0-15 in 2014/15 to 49 in 2019/20. This trend is the same when looking at rates for illnesses only (excluding injuries), where rates per 1,000 children aged 0-15 decreased from 51 in 2014/15 to 35 in 2019/20.

Source: Health and Disability Intelligence, Ministry of Health
The Ministry of Health have analysed the data on a monthly basis and note that the numbers of patients decreased significantly since March of 2020. This could be in part due to children not presenting to hospital during the COVID-19 lockdown even when they needed care, and so it is possible that we will see some increases in the rates for 2020/21 as children present to hospital later in the year. However, the lower rates may also reflect an improvement in the rates of illness and injury for these groups. Social distancing has reduced the rates of infectious illnesses,[34] and the nationwide lockdown may have also resulted in a reduction in injuries due to less travel, and less sport played.
Rates for different socioeconomic groups#
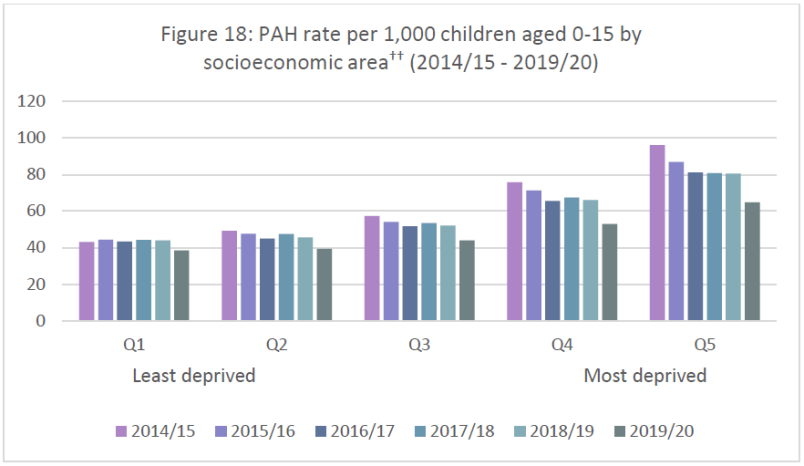
As noted in previous reports, rates of potentially avoidable hospitalisations are higher among children living in more deprived areas, and rates for the more deprived areas declined rapidly over 2014/15 - 2016/17 before flattening out. We also see a bigger drop in potentially avoidable hospitalisation rates for 2019/20 in the more deprived areas.
Source: Health and Disability Intelligence, Ministry of Health
Rates for different ethnic groups#
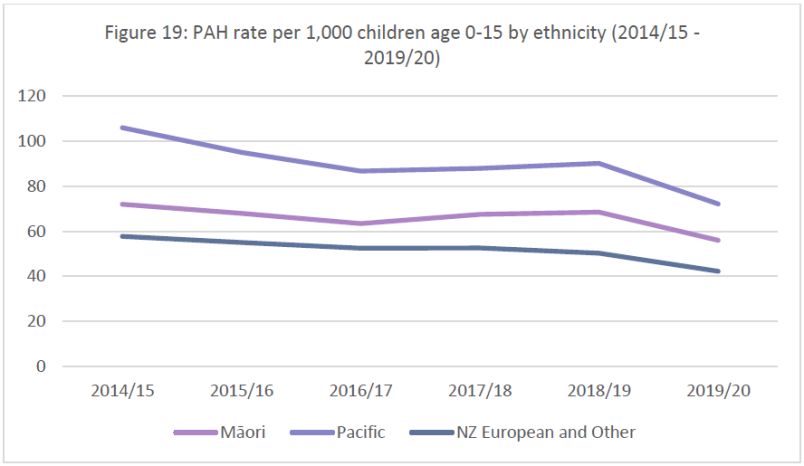
Māori and Pacific children have higher rates of potentially avoidable hospitalisations. In 2019/20, potentially avoidable hospitalisations for Pacific children aged 0-15 were 72 per 1,000 children; and 56 per 1,000 Māori children. This compares with 42 per 1,000 children of European and other ethnic backgrounds. These findings are similar to those of a University of Canterbury study, which found that rates for all illnesses, particularly respiratory illnesses, are highest among Māori and Pacific children.[35]
The decrease for Pacific children in 2019/20 was greater than for Māori or European children, reducing the gap between rates for children of different ethnicities. However, there are still differences between these ethnic groups.
Source: Health and Disability Intelligence, Ministry of Health
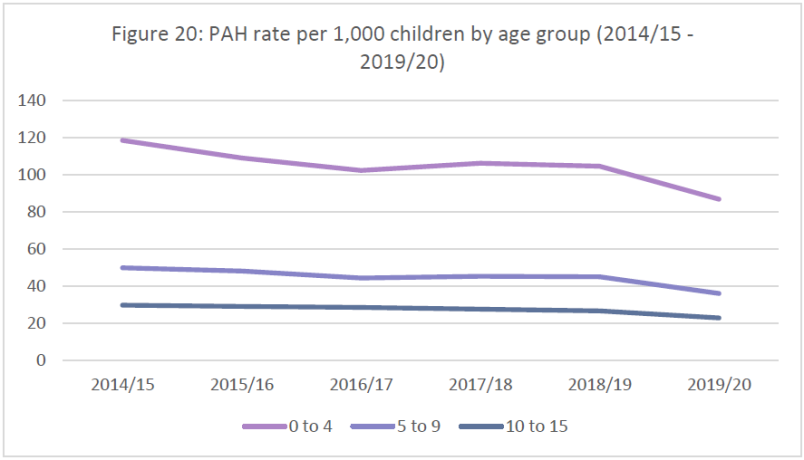
Other key observations#
Rates of potentially avoidable hospitalisations are highest amongst younger children. In 2019/20 the rate of potentially avoidable hospitalisations for children aged 0-4 was 87 per 1,000 children, compared with 23 per 1,000 children aged 10-15. Younger children are particularly vulnerable to unhealthy environments (e.g. low-quality housing) due to their still-developing immune systems. Recent research by the University of Canterbury indicates that up to a third of all hospitalisations for children under five could be avoided with good access to quality housing, health services, and fluoridated drinking water.[36]
Source: Health and Disability Intelligence, Ministry of Health
Overall, we can see the largest drops for 2019/20 in the groups that have the highest rates – younger children, children living in higher deprivation areas, Pacific children, and Māori children. However, the gaps between these groups and the general population remain.
Rates of potentially avoidable hospitalisations were highest for respiratory conditions and unintentional injuries (both 13 per 1,000 children in 2019/20), which were the same highest categories as the previous year. Other notable conditions included gastrointestinal diseases (5 per 1,000 children) and dental conditions (4 per 1,000 children).
To improve potentially avoidable hospitalisations, we have:
- Extended free and low-cost doctors' visits for children under the age of 14 enrolled with a GP, reaching 56,000 more young people.
- Lowered the cost of visiting a doctor or nurse for adults with a Community Services Card, and their dependants aged 14 to 17 years, who are enrolled with a GP.
- Expanded and enhanced school-based health services to reach over 96,170 students across 300 schools.
In response to COVID-19, we have:
- Continued to support the sustainability of WellChild Tamariki Ora service providers through Budget 2020 to deliver child health services including immunisations, health checks and other essential services.
- Boosted funding for Whānau Ora to support the health and wellbeing of whānau and communities.
From 2021 onwards, we are:
- Expanding the Ministry of Health's Health Homes Initiative to improve the quality of housing to prevent childhood hospitalisations.
- Funding an additional 20 mobile dental clinics to improve access to dental services for children and young people.
- Shifting decision-making for water fluoridation to the Director-General of Health.
- Expanding Mana Ake to provide mental health and wellbeing support for children in primary school years to five more regions.
ANNEX ONE: Further details on data, including sources and methods#
COVID-19#
COVID-19 arrived in New Zealand in 2020, resulting in a national lockdown, a number of regional lockdowns, and ongoing economic and social challenges. While it is still too early to know the precise impact COVID-19 will have on child poverty, past experience and initial modelling by the Treasury indicate that rates of child poverty are likely to increase.
Only some of the Child Poverty Related Indicators (CPRIs) in this report capture the impacts of COVID-19 and the national lockdown:
- The pandemic disrupted the collection of the Household Economic Survey (housing affordability and quality indicators) and New Zealand Health Survey (food insecurity indicator), which were both suspended at the end of March 2020 (instead of June 2020). The 2019/20 data therefore serves as a pre-COVID baseline for these indicators.
- The school attendance data usually covers attendance for all of Term 2. Due to the lockdown, the data for 2020 only covers the last 7 weeks of Term 2 after lockdown when students physically attended schools, so will show some impact of COVID-19.
- Data for the potentially avoidable hospitalisations indicator have been gathered before and during the COVID-19 period, from July 2019 to June 2020, so will also show some impact of COVID-19.
While most of the data and indicators in next year's report will be post-COVID, due to the way some data is collected, it will still include data that relates to the time before COVID-19[††]. See the table below for more detail.
Table 1: Details on indicator data sources and reporting timeframes
| CPRI | Latest data source | Data lag for this year's report | Frequency of reporting | Next round of data |
|---|---|---|---|---|
| Housing affordability | Household Economic Survey 2019/20 (Stats NZ) | Data based on annual household incomes data and experiences for households interviewed from mid-2019 to March 2020, for the period 12 months prior (in some cases, back to mid-2018). | Annually | 2020/21 data available early 2022 |
| Housing quality | ||||
| Food insecurity | NZ Health Survey 2019/20 (Ministry of Health) | Data based on experiences for households interviewed from mid-2019 to March 2020, for the period 12 months prior (in some cases, back to mid-2018). | Annually | 2020/21 data available early 2022 |
| Regular school attendance | Attendance Survey 2020 (Ministry of Education) | Data based on attendance monitored over the course of Term 2 2020. | Annually | 2021 data available early 2022 |
| Potentially avoidable hospitalisations | Ministry of Health data 2019/20 | Data sourced from the National Minimum Dataset for Hospital Inpatient Events. Data required to be loaded within 21 days after the month of discharge. | Annually | 2020/21 data available early 2022 |
Approach to reporting on data by socioeconomic group#
We have reported on each indicator by socioeconomic status. We have used different measures of socioeconomic status across the indicators:
- Annual household income quintiles (used for the housing affordability and quality indicators): Though it is recognised that socioeconomic disadvantage usually reflects a broader range of factors than income, household income is used as a proxy for socioeconomic status in this report. Income groups are quintiles (to the nearest hundred dollars) of household equivalised disposable income. Equivalised income is a measure of household income that takes account of the differences in a household's size and composition. Quintiles are formed by dividing the total population of households into 5 groups of equal size, based on their equivalised disposable income.
- NZDep13 quintiles (used for the food insecurity and potentially avoidable hospitalisations indicators): NZDep13 is an index of socioeconomic deprivation based on Census data relating to income, home ownership, employment, qualifications, family structure, housing, access to transport and communications. It provides a deprivation score for each meshblock (smallest geographical area) in New Zealand. This report uses NZDep13 quintiles, where quintile 1 represents the 20 percent of small areas with the lowest levels of deprivation (the least deprived areas) and quintile 5 represents the 20 percent of small areas with the highest level of deprivation (the most deprived areas).
- School deciles (used for the regular school attendance indicator): Deciles are a measure of the socioeconomic position of a school's student community relative to other schools throughout the country. A school's decile is based on the small Census areas where its students live (meshblocks), not on the general area of the school. Deciles are based on five equally weighted socioeconomic indicators for a community (including household income, parent occupation, household crowding, parent qualification and income support receipt). The Ministry of Education's school decile system is used to target funding to help schools overcome any barriers to learning that students from lower socioeconomic communities might face (the lower the school's decile, the more funding it receives).
Ethnicity Information#
Ethnicity is recorded slightly differently in each of the surveys used as source data for the CPRIs.
- Housing affordability and housing quality indicators: ethnic groups are reported using the total response method. People were able to identify with more than one ethnic group; therefore, figures will not sum to the total population. People who responded 'New Zealander' were classified as 'other ethnic group'.
- Food security: respondents can identify with multiple ethnicities, including specifying an ethnic group not listed.
- School attendance: students were able to identify with up to three ethnicities. Students are counted under each ethnic group they identify with and once in "Total".
- Potentially avoidable admissions: The ethnicity reported is based on prioritised ethnicity for a patient within the hospital inpatient system. This prioritises people to Māori, then Pacific, and then Other ethnicities. A person identified as having more than one ethnicity will be prioritised accordingly and will only be counted once under each ethnicity category for each PAH event.
Housing affordability and quality#
The data on housing affordability and quality was prepared by Stats NZ based on the Household Economic Survey (HES). HES collects information on household income, savings, and expenditure, as well as demographic information on individuals and households. For HES 2018/19, changes to the survey including a larger sample size means the housing affordability and quality indicators can be reported on by income quintile and ethnicity (this has not been possible previously). In addition, to improve data precision, income data is based on administrative data from the IDI, rather than respondents being required to answer this question themselves. Further information on the HES methodological changes can be found on the Stats NZ website.
For the housing affordability indicator, the OTI ratios are not mutually exclusive. Households that spend more than 40% of their household disposable income on housing costs will also be included in the more than 30% category.
The data for quintile 1 (lowest income quintile) includes loss from investments or self-employed income, or no income received. Investigation by Stats NZ of the characteristics of the households that make up the group with very low income has shown that many of these households do not have the high deprivation scores we might expect of households with low income. This suggests that either the reported income value is incorrect, these households have access to economic resources such as wealth, or that the instance of low or negative income is temporary. This has an impact on the data reported for quintile 1.
Food insecurity#
The data on food insecurity is based on a single question asked as part of the New Zealand Health Survey. The question was asked in the years up to 2015/16, but was not asked again until the 2019/20 survey (in the field until end March 2020). The question is one of eight that makes up the food security index, which is a weighted combination of responses to the following questions by the adult respondent, answering often, sometimes or never:
- We cannot afford to eat properly
- Food runs out in our household due to lack of money
- We eat less because of lack of money
- The variety of foods we are able to eat is limited by a lack of money
- We rely on others to provide food and/or money for food, for our household, when we don't have enough money
- We make use of special food grants or food banks when we do not have enough money for food
- I feel stressed because of not having enough money for food
- I feel stressed because I can't provide the food I want for social occasions.
The answers to the questions are used as a basis to determine severe-to-moderate food insecurity, and severe food insecurity, among children in New Zealand households. A 2019 report on household food insecurity among children in New Zealand can be found on the Ministry of Health website.
The data used in this report do not impute values for responses where interviewees answered 'don't know', or refused to answer the question. Therefore, the data reported here differ slightly from those reported by the Ministry of Health's food security publication, for which imputed responses were used.
Regular attendance#
The Ministry of Education reports annually on student attendance, based on data generated during Term 2 of the school year (between the end of April and beginning of July). It is a voluntary survey run across primary and secondary schools. Regular attendance is defined as students attending school for more than 90% of available half days.
The Ministry of Education's attendance data does not report on student attendance by age. The Attendance Survey covers all students (aged 5 to 18+) from participating schools, and the data is presented by student year levels. This CPRI specifically looks at the attendance rates of students ages 6 to 16, whereby age is determined by joining attendance data with the National Student Index. Through doing so, we note minor differences to the Ministry of Education's published results. These have an immaterial impact on overall results and trends (+/- 1%).
The Ministry of Education's report on 2020 attendance for all students can be found on their website.
Potentially avoidable hospitalisations#
The Ministry of Health does not routinely collect data on potentially avoidable hospitalisations. In order to present data for this indicator, the Ministry of Health used the National Minimum Dataset (Hospital Inpatient Events) and developed a specific methodology based on analysis from academic literature and discussions with experts. The methodology report has been published by the Ministry of Health (Ministry of Health. Indicator of potentially avoidable hospitalisations for the Child and Youth Wellbeing Strategy: A brief report on methodology. Wellington: Ministry of Health. 2020).
References#
1. Dockery, A. et al. Housing and children's development and wellbeing: a scoping study. Melbourne: Australian Housing and Urban Research Institute. 2010.
2. Clair, A. Housing: An Under-Explored Influence on Children's Wellbeing and Becoming. Child Indicators Research 12: p. 609-626. 2019
3. Environmental Health Indicators New Zealand. Household crowding. Wellington: Massey University. 2018. Available online: https://www.ehinz.ac.nz/indicators/indoor-environment/household-crowding/
4. Stats NZ. Living in a crowded house: Exploring the ethnicity and wellbeing of people in crowded households. Wellington: Stats NZ. 2018. Available online: https://www.stats.govt.nz/reports/living-in-a-crowded-house-exploring-the-ethnicity-and-well-being-of-people-in-crowded-households
5. Ingram T. et al. Damp mouldy housing and early childhood hospital admissions for acute respiratory infection: a case control study. Thorax 74: p. 849-857. 2019.
6. Child Poverty Action Group. A New Zealand where Children can flourish: Priorities for health. Auckland: Child Poverty Action Group. 2017. Available online: https://www.cpag.org.nz/campaigns/a-new-zealand-where-children-can-flourish/priorities-for-health/
7. Miller MD, et al. Differences between children and adults: implications for risk assessment at California EPA. International Journal of Toxicology 21(5): p. 403-418. 2002.
8. Johnson, A. et al. A Stocktake of New Zealand's Housing. Wellington: New Zealand Government. 2018.
9. Child Poverty Action Group. Our children, our choice: priorities for policy. Auckland: Child Poverty Action Group. 2014. Available online: https://www.cpag.org.nz/resources/our-children-our-choice-priorities-for-policy-7/
10. Ministry of Social Development. Reporting on low-income and material hardship trends for children in the 2018 Household Incomes Report. Wellington: Ministry for Social Development. 2018. Available online: https://www.msd.govt.nz/documents/about-msd-and-our-work/publications-resources/monitoring/household-income-report/2018/report-18-09-1272-to-minister-sepuloni.pdf
11. Perry, B. The material wellbeing of New Zealand households: trends and relativities using non-income measures, with international comparisons. Wellington: Ministry of Social Development. 2019.
12. Ministry of Health. Household Food Insecurity Among Children in New Zealand. Wellington: Ministry of Health. 2019. Available online: https://www.health.govt.nz/system/files/documents/publications/household-food-insecurity-among-children-new-zealand-health-survey-jun19.pdf
14. Grant, C.C. et al. Nutrition and Indigenous health in New Zealand. Journal of Paediatrics & Child Health 46(9): p. 479-482. 2010.
15. Wynd, D. Hunger for learning. Nutritional barriers to children's learning. Auckland: Child Poverty Action Group. 2011.
16. World Health Organization. Double-duty actions. Policy brief. 2017.
17. Baer, T.E. et al. Food insecurity and the burden of health-related social problems in an urban youth population. Journal of Adolescent Health. 57(6): p. 601-607. 2015.
18. Ministry of Health. Household Food Insecurity Among Children in New Zealand. Wellington: Ministry of Health. 2019. Available online: https://www.health.govt.nz/system/files/documents/publications/household-food-insecurity-among-children-new-zealand-health-survey-jun19.pdf
19. Ministry of Health. Household Food Insecurity Among Children in New Zealand. Wellington: Ministry of Health. 2019. Available online: https://www.health.govt.nz/system/files/documents/publications/household-food-insecurity-among-children-new-zealand-health-survey-jun19.pdf
20. Carter K, et al. What are the determinants of food insecurity in New Zealand and does this differ for males and females? Australian and New Zealand Journal of Public Health. 34(6): p. 602–608. 2010.
21. Utter J, et al. Rising food security concerns among New Zealand adolescents and association with health and wellbeing. Kotuitui. 13(1): p. 29–38. 2018.
22. Franks, J. Coronavirus: Demand for food banks double pre-Covid levels, and still growing. Published online: https://www.stuff.co.nz/national/122093506/coronavirus-demand-for-food-banks-double-precovid-levels-and-still-growing
23. Webber, A. He Whakaaro: What is the relationship between attendance and attainment? Wellington: Ministry of Education. 2020. Available online: https://www.educationcounts.govt.nz/publications/series/he-whakaaro/he-whakaaro-what-is-the-relationship-between-attendance-and-attainment
24. McGregor A. and Webber A. He Whakaaro: School attendance and student wellbeing. Wellington: Ministry of Education. 2020. Available online: https://www.educationcounts.govt.nz/publications/series/he-whakaaro/he-whakaaro-school-attendance-and-student-wellbeing
25. Ministry of Education. Children living in low income households. Wellington: Ministry of Education. 2012. Available online: https://www.educationcounts.govt.nz/statistics/indicators/definition/family-and-community-engagement/children_living_in_low_income_households
26. White, M. et al. Poverty and education: A teacher's perspective – Summary of the findings of the focus group research. British Columbia: British Columbia Teachers' Federation. 2012. Available online: https://www.bctf.ca/PovertyResearch.aspx
27. Webber, A. He Whakaaro: Is COVID-19 making students leave school? Wellington: Ministry of Education. 2020. Available online: https://www.educationcounts.govt.nz/publications/series/he-whakaaro/he-whakaaro-is-covid-making-students-leave-school
28. Webber, A. He Whakaaro: Is COVID-19 making students leave school? (p. 10) Wellington: Ministry of Education. 2020. Available online: https://www.educationcounts.govt.nz/publications/series/he-whakaaro/he-whakaaro-is-covid-making-students-leave-school
29. Webber, A. He Whakaaro: How COVID-19 is affecting school attendance. Wellington: Ministry of Education. 2020. Available online: https://www.educationcounts.govt.nz/publications/schooling/he-whakaaro-how-covid-19-is-affecting-school-attendance
30. Child Poverty Action Group. A New Zealand where Children can flourish: Priorities for health. Auckland: Child Poverty Action Group. 2017. Available online: https://www.cpag.org.nz/campaigns/a-new-zealand-where-children-can-flourish/priorities-for-health/
31. Ministry of Health. Health and Independence Report 2017: The Director General of Health's Annual Report on the State of Public Health. Wellington: Ministry of Health. 2018. Available online: https://www.health.govt.nz/about-ministry/corporate-publications/health-and-independence-reports
32. Bidwell, S. Improving access to primary health care for children and youth. Christchurch: Canterbury DHB. 2013. Available online: https://www.cph.co.nz/wp-content/uploads/accessprimarycarechildrenyouth.pdf
33. Braveman, P. et al. How does housing affect health? Princeton: Robert Wood Johnson Foundation. 2011. Available online: https://www.rwjf.org/en/library/research/2011/05/housing-and-health.html
34. Huang, Q.S., Wood, T., Jelley, L. et al. Impact of the COVID-19 nonpharmaceutical interventions on influenza and other respiratory viral infections in New Zealand. Nat Commun 12, 1001 (2021). https://doi.org/10.1038/s41467-021-21157-9
35. Hobbs. M, et al. Investigating the rates and spatial distribution of childhood ambulatory sensitive hospitalisations in New Zealand. Christchurch: University of Canterbury. 2019. Available online: https://ir.canterbury.ac.nz/handle/10092/16898
36. Hobbs. M, et al. Investigating the rates and spatial distribution of childhood ambulatory sensitive hospitalisations in New Zealand. Christchurch: University of Canterbury. 2019. Available online: https://ir.canterbury.ac.nz/handle/10092/16898.
Footnotes#
- [*]Annual equivalised household income quintile (Q1 is the bottom fifth of households, Q5 is the top fifth)
- * Respondents to the HES are asked whether their house has a 'major' problem with damp or mould; a 'minor' problem with damp or mould; or 'no problem' with damp or mould.
- [†]Annual equivalised household income quintile.
- (††)NZDep13 quintiles, where Q1 refers to the least deprived areas, and Q5 refers to the most deprived areas.
- [§]This graph displays the proportion of students aged 6-16 attending school regularly. The rates for the irregular, moderate and chronic attendance categories are based on all students in Years 1-13. The rates and trends observed across all students are broadly the same for students aged 6-16 only.
- (*) The data reported here includes children aged 0 to 14 years and 11 months, and is reported as children aged 0-15. All PAH rates presented are age standardised.
- [**]Socioeconomic areas identified using NZDep13 quintiles
- [††]For the Household Economic Survey, respondents are asked about the year immediately prior to their survey interview. Therefore, people who are interviewed in July 2020 will provide data that covers the period back to July 2019.